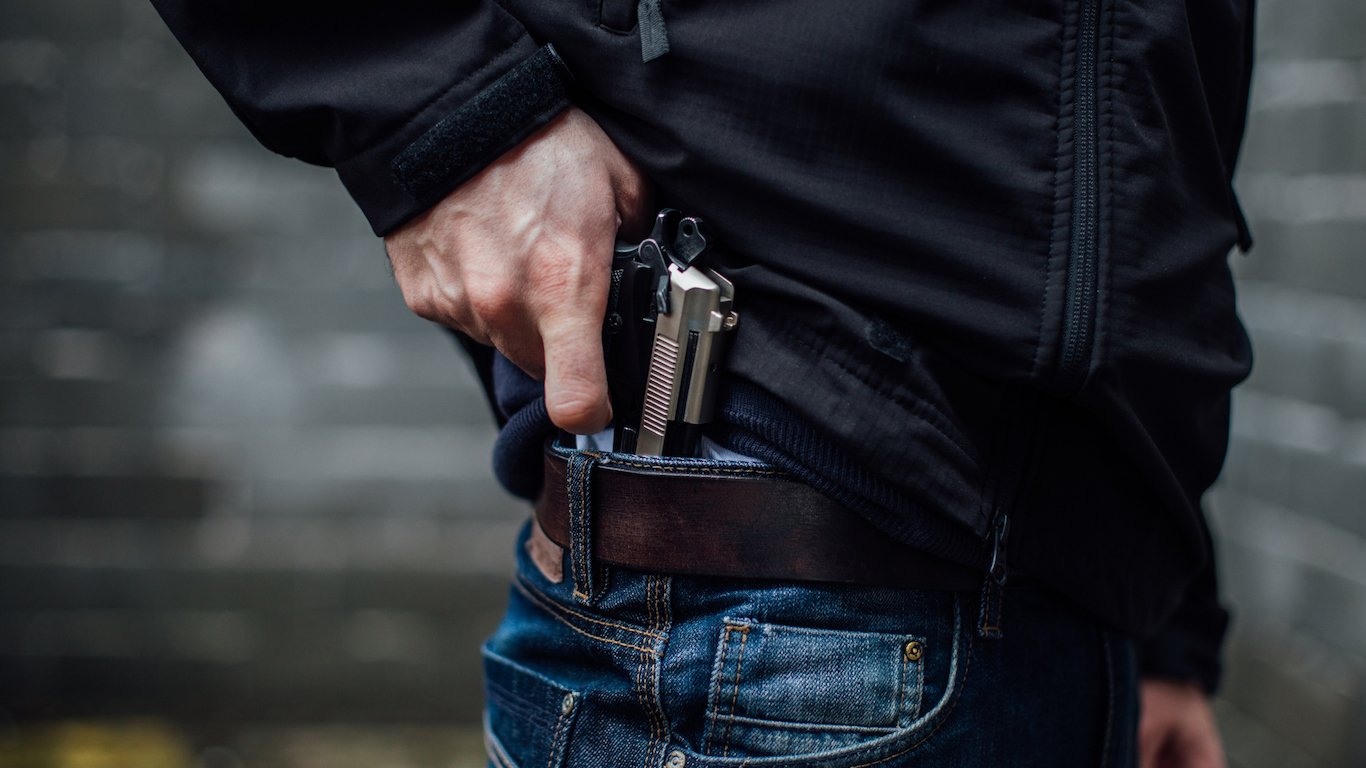
Firearm sales have surged in the U.S. in recent years. A recent Gallup poll found that 42% of Americans now report having a gun in their home — and for nearly a third of them, the primary reason is for hunting.
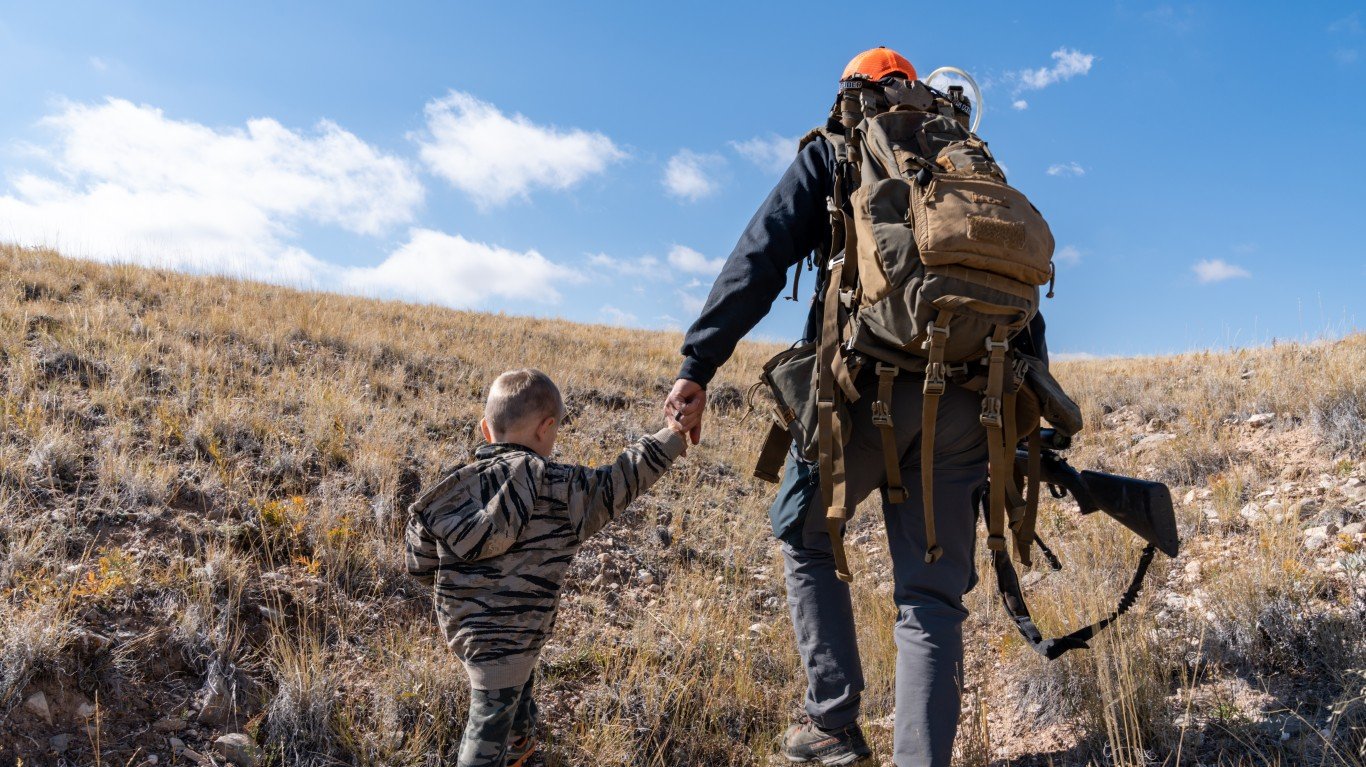
Figures from the U.S. Fish and Wildlife Service show that the number of licensed hunters hit a 35-year high in 2021 — the latest year of available data — topping 15.9 million for the first time since 1987. While hunters who use bows or muzzleloaders often have longer hunting seasons — and sometimes larger bag limits and access to more hunting ground — the vast majority of sports men and women in the U.S. prefer to hunt with a modern rifle or shotgun. (Here is a look at the 14 most versatile hunting rifles.)
According to the National Deer Association, a wildlife and habitat preservation organization, over 6.9 million Americans hunted with a firearm in 2021, far more than the 4.7 million who hunted with a bow or muzzleloader. Adjusting for population with 2021 census data, there are about 21 hunters who use firearms for every 1,000 people in the United States — and in some parts of the country, the concentration is far higher.
Using data from the NDA and U.S. Census Bureau’s 2021 American Community Survey, 24/7 Wall St. identified the states where the most people hunt with firearms, a category including rifles, shotguns, and handguns. We ranked the 39 states with available data on the number of firearm hunters for every 1,000 state residents in 2021. Supplemental data on the share of deer harvested with a rifle or shotgun is from the NDA, and the total number of paid hunting license holders by state is from the FWS.
Depending on the state, the number of hunters who use a firearm ranges from about 1,930 to over 700,000. Meanwhile, the concentration of hunters who use firearms is anywhere from about 2 for every 1,000 people to 132 per 1,000, depending on the state.
In many of the highest ranking states on this list, hunting tends to be more popular in general. In each of the six states with the highest concentration of hunters who use firearms, the total population-adjusted number of licensed hunters is more than double the national average of 48 per 1,000 people. (Here is a look at the most popular American hunting destinations.)
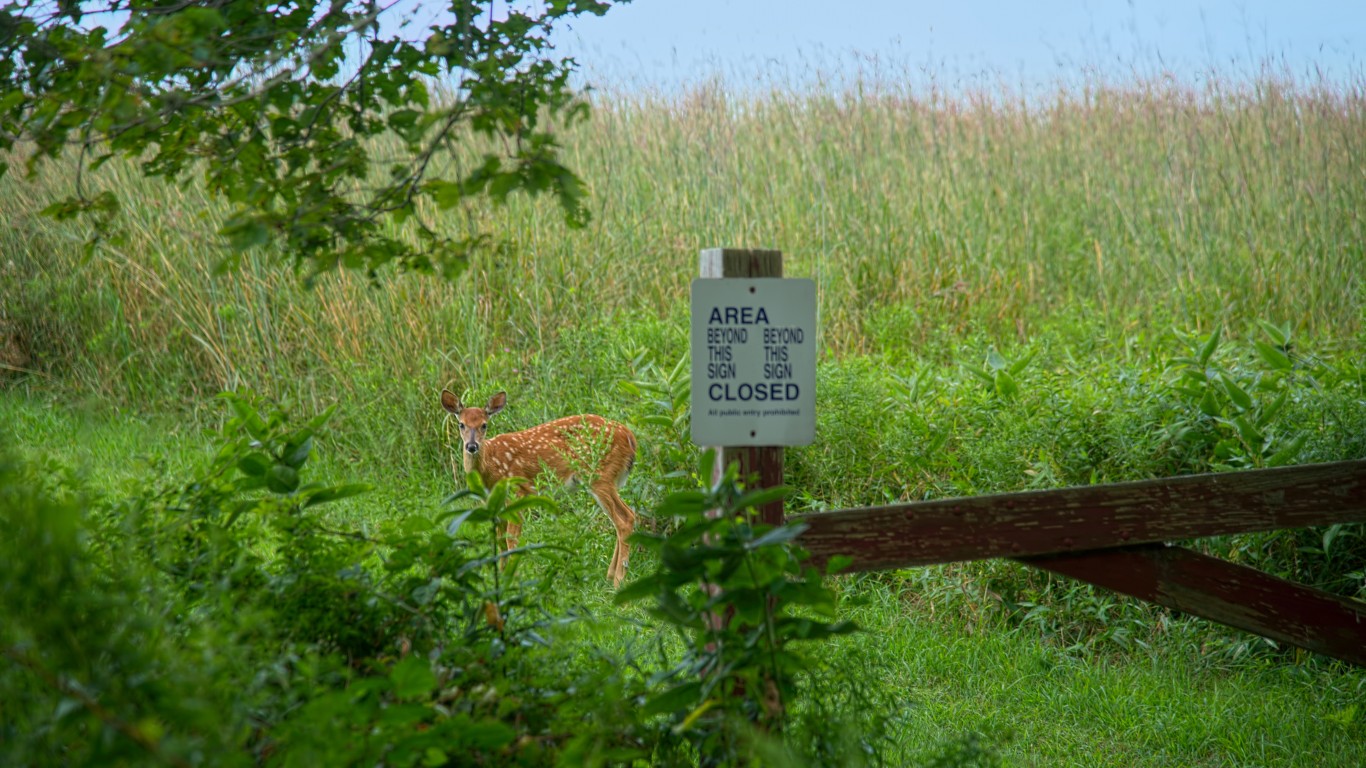
In several of the lowest ranking states on this list, limited use of firearms among hunters is likely due in large part to legal restrictions. In Rhode Island, for example, deer hunting with a centerfire rifle is prohibited. Partially as a result, nearly 90% of deer harvested in the state in 2021 were taken with a bow or muzzleloader. For comparison, only about a third of all deer harvested nationwide the same year were killed with a bow or muzzleloader.
These are the states where the most people hunt with a firearm.
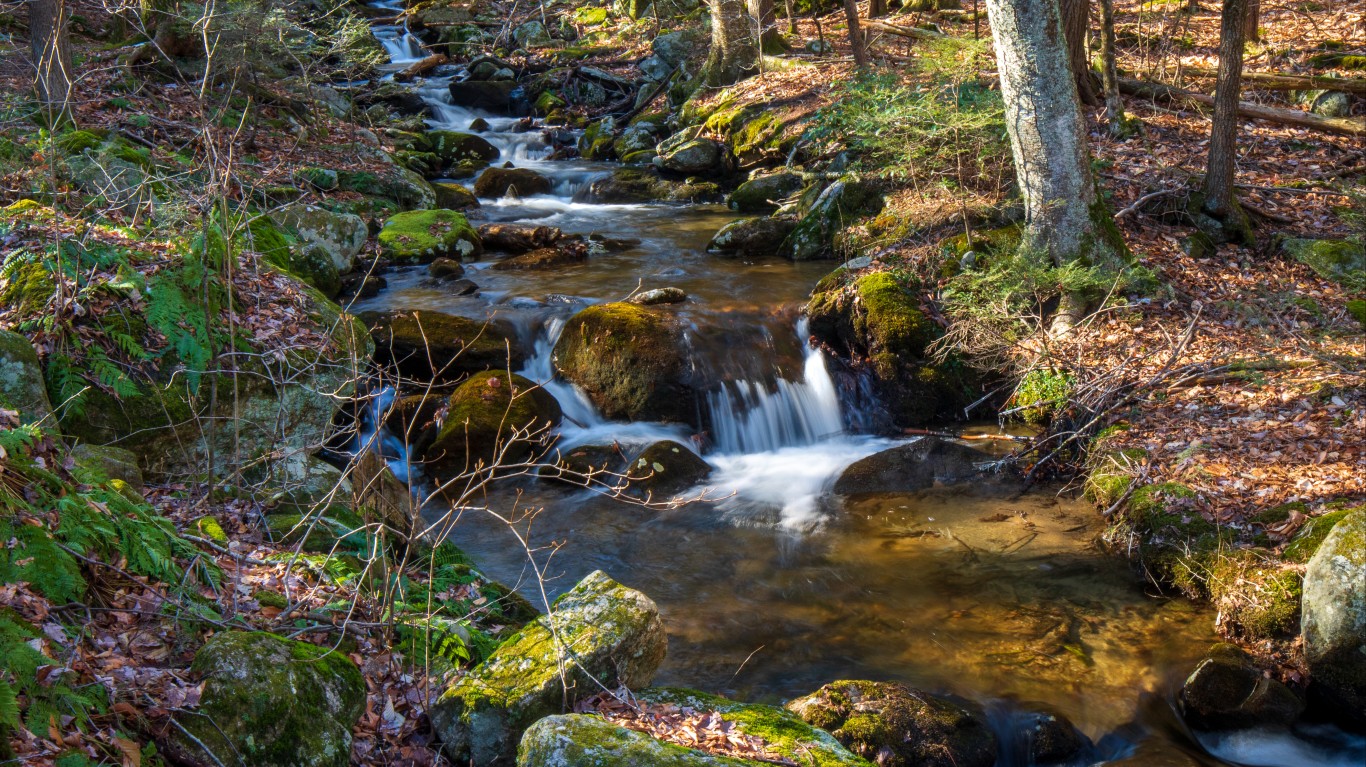
39. Rhode Island
Source: Joesboy / iStock via Getty Images
- Population hunting with a firearm in 2021: 1.8 per 1,000 people (1,929 total)
- Paid hunting license holders in 2021: 7.3 per 1,000 people (7,985 total)
- Share of deer harvested with a rifle or shotgun in 2021: 12%
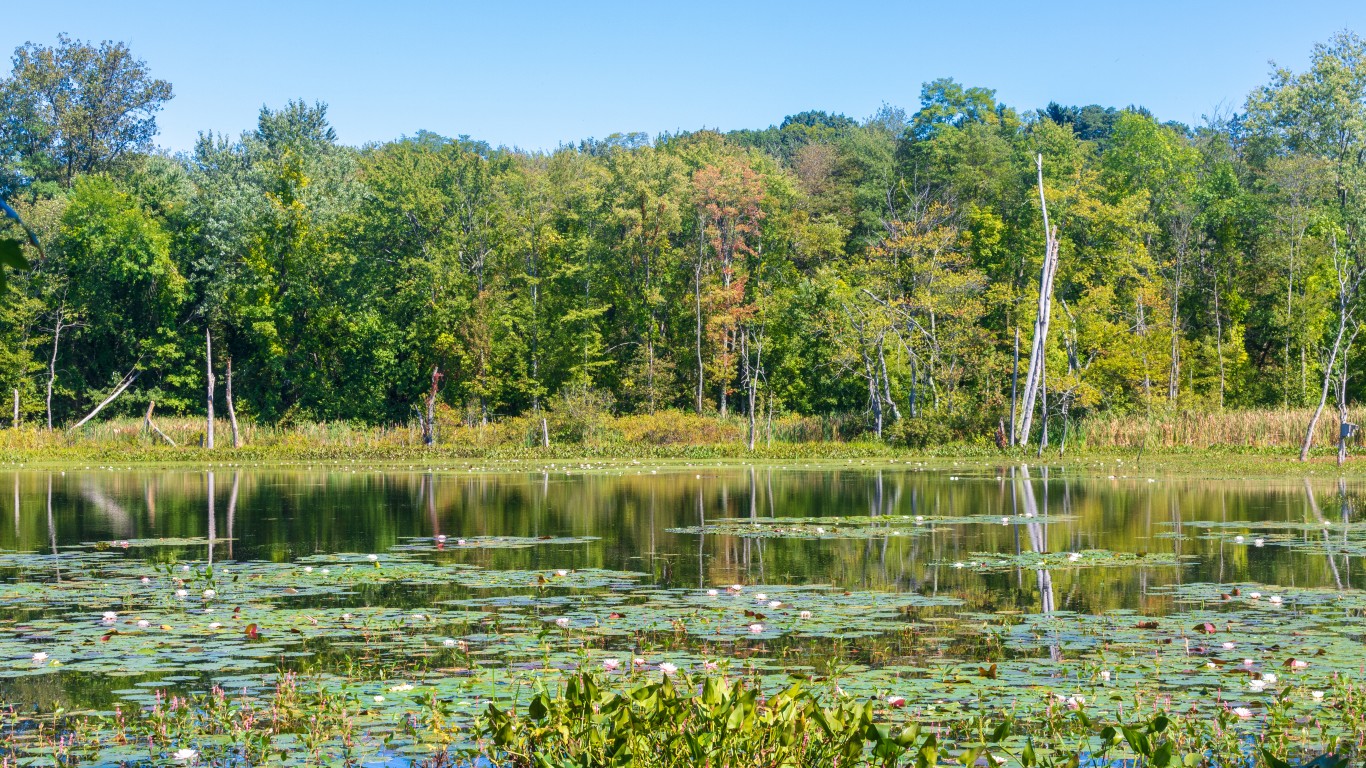
38. New Mexico
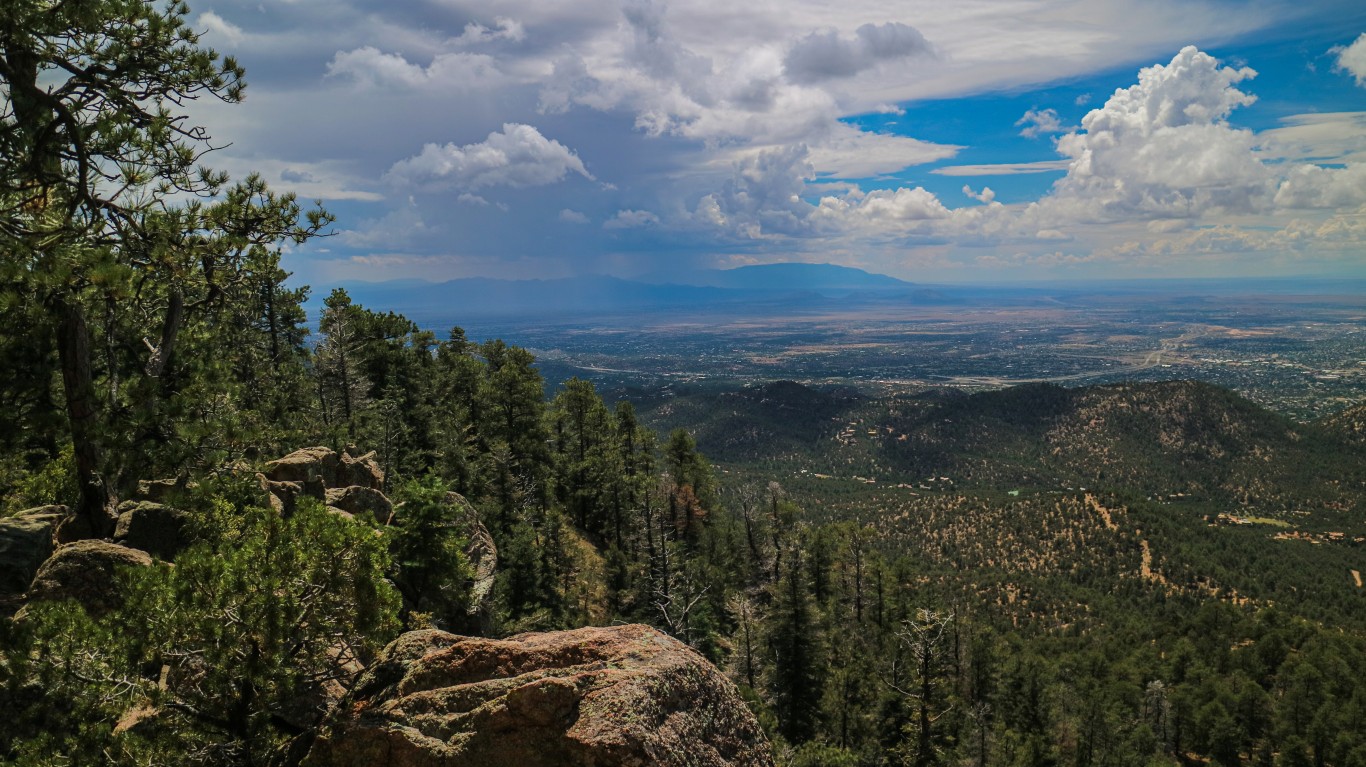
Source: Laurie Drake / iStock via Getty Images
- Population hunting with a firearm in 2021: 4.1 per 1,000 people (8,610 total)
- Paid hunting license holders in 2021: 66.5 per 1,000 people (140,685 total)
- Share of deer harvested with a rifle or shotgun in 2021: N/A
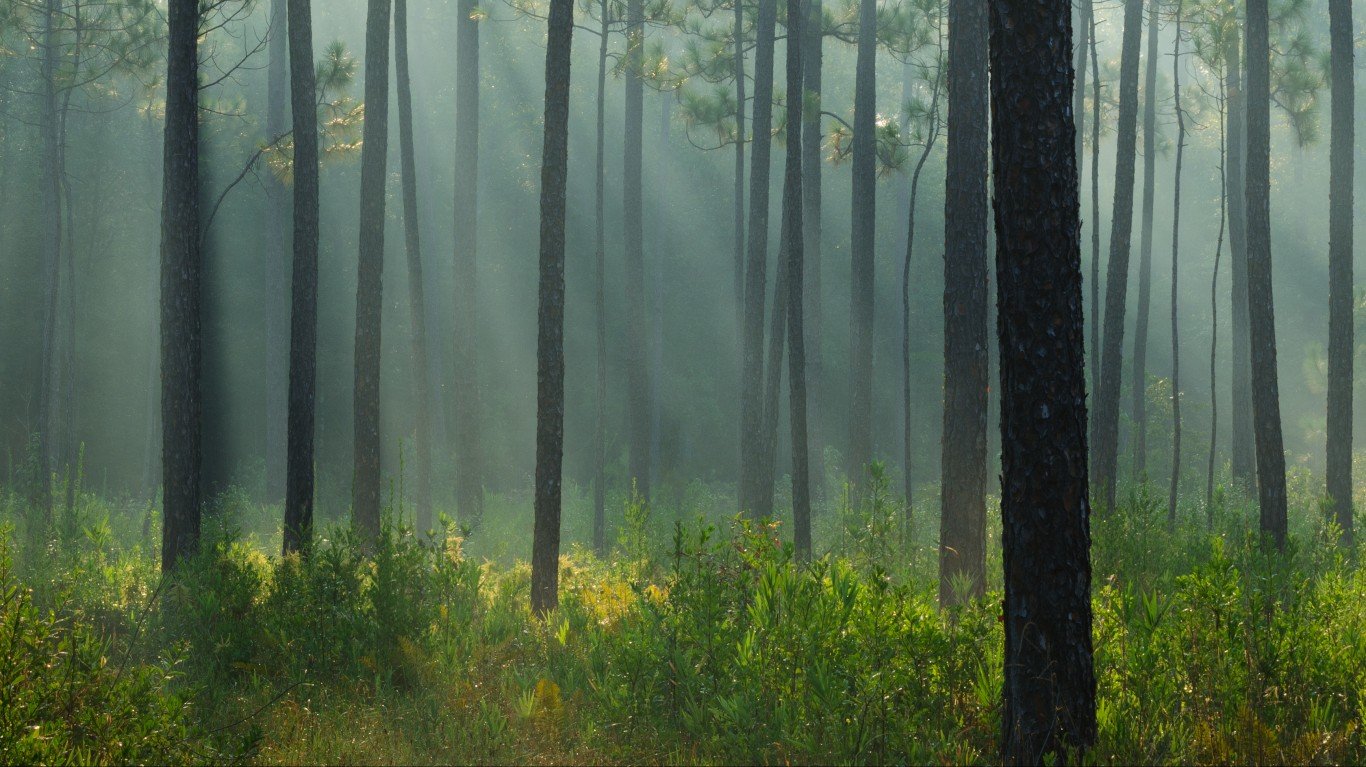
37. Florida

- Population hunting with a firearm in 2021: 4.3 per 1,000 people (94,309 total)
- Paid hunting license holders in 2021: 10.0 per 1,000 people (217,113 total)
- Share of deer harvested with a rifle or shotgun in 2021: 67%
36. Connecticut
Source: Jennifer Yakey-Ault / iStock via Getty Images
- Population hunting with a firearm in 2021: 4.5 per 1,000 people (16,301 total)
- Paid hunting license holders in 2021: 8.5 per 1,000 people (30,807 total)
- Share of deer harvested with a rifle or shotgun in 2021: 35%
35. Massachusetts
Source: Jennifer Yakey-Ault / iStock via Getty Images
- Population hunting with a firearm in 2021: 5.5 per 1,000 people (38,640 total)
- Paid hunting license holders in 2021: 8.5 per 1,000 people (59,652 total)
- Share of deer harvested with a rifle or shotgun in 2021: 32%
34. Arizona
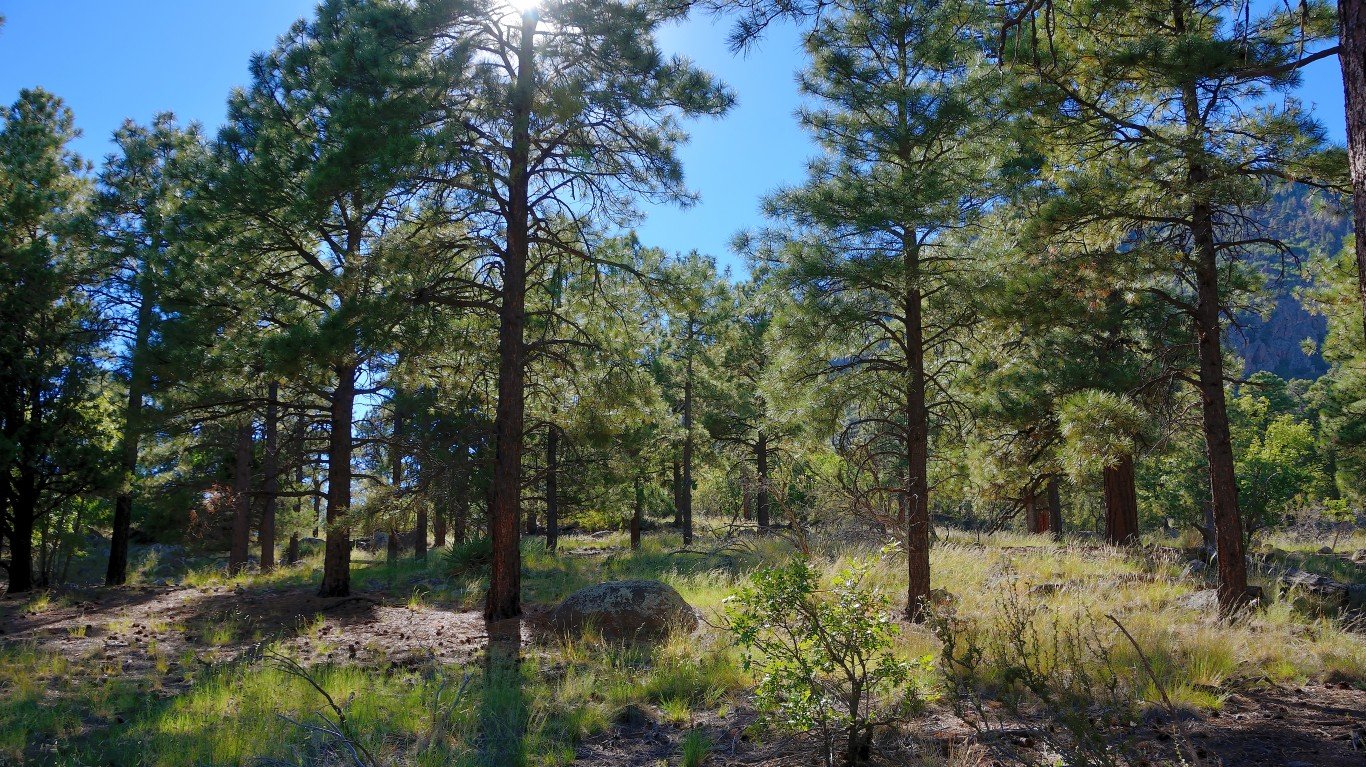
Source: MarciParavia / iStock via Getty Images
- Population hunting with a firearm in 2021: 5.9 per 1,000 people (42,860 total)
- Paid hunting license holders in 2021: 48.0 per 1,000 people (349,554 total)
- Share of deer harvested with a rifle or shotgun in 2021: N/A
33. New Jersey

- Population hunting with a firearm in 2021: 6.8 per 1,000 people (63,457 total)
- Paid hunting license holders in 2021: 7.7 per 1,000 people (71,707 total)
- Share of deer harvested with a rifle or shotgun in 2021: 26%
32. Maryland
Source: ALFSnaiper / iStock via Getty Images
- Population hunting with a firearm in 2021: 7.3 per 1,000 people (45,000 total)
- Paid hunting license holders in 2021: 18.9 per 1,000 people (116,422 total)
- Share of deer harvested with a rifle or shotgun in 2021: 50%
31. Washington
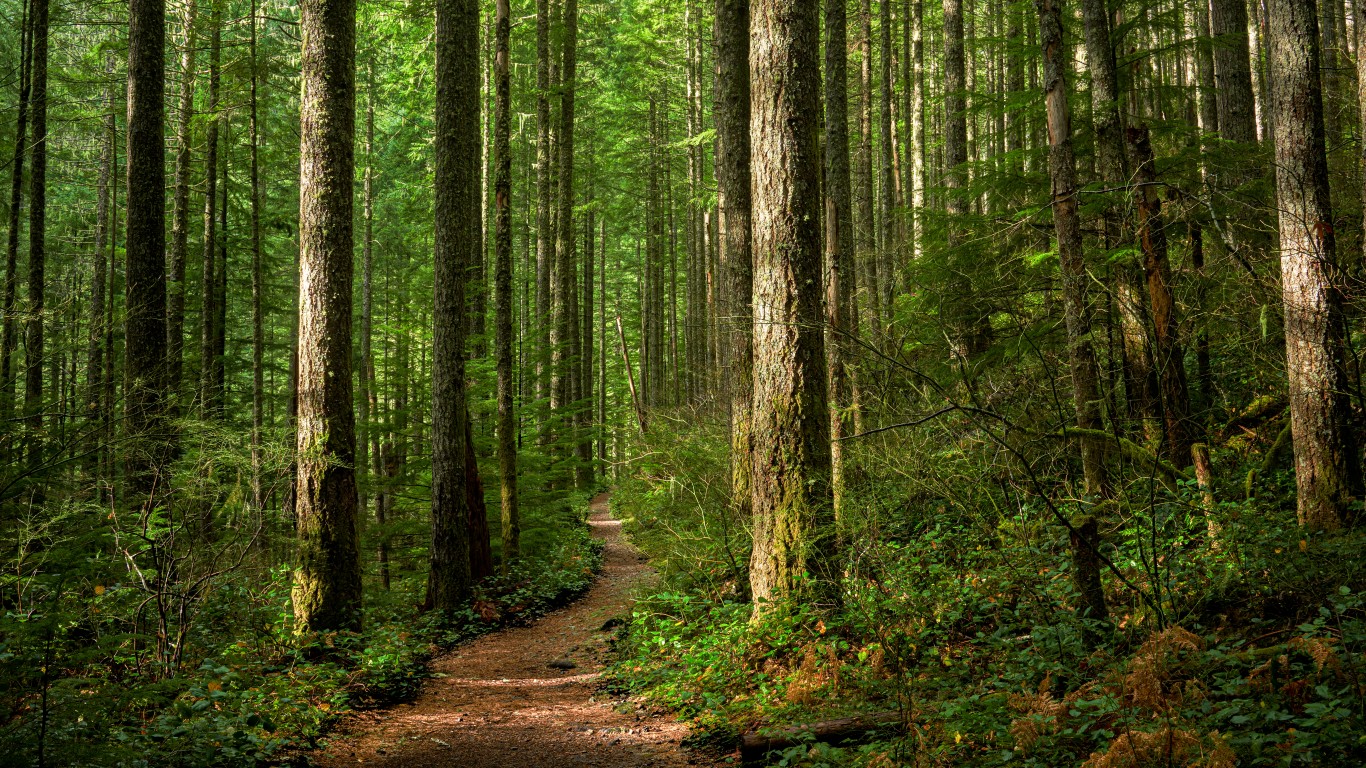
Source: Alexander Fattal / iStock via Getty Images
- Population hunting with a firearm in 2021: 10.2 per 1,000 people (78,718 total)
- Paid hunting license holders in 2021: 23.9 per 1,000 people (185,147 total)
- Share of deer harvested with a rifle or shotgun in 2021: 86%
30. Colorado

- Population hunting with a firearm in 2021: 12.3 per 1,000 people (71,395 total)
- Paid hunting license holders in 2021: 63.8 per 1,000 people (370,736 total)
- Share of deer harvested with a rifle or shotgun in 2021: 87%
29. Illinois
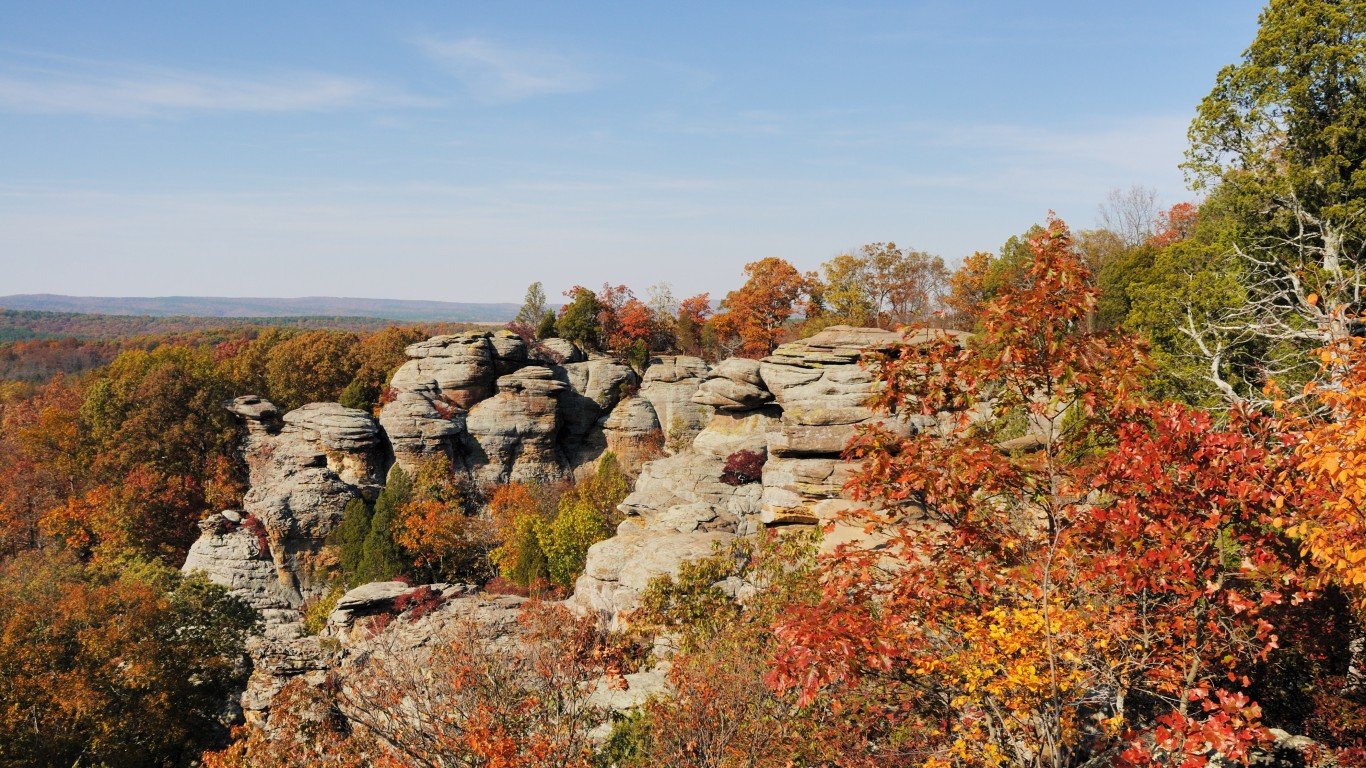
Source: Purdue9394 / iStock via Getty Images
- Population hunting with a firearm in 2021: 13.0 per 1,000 people (165,011 total)
- Paid hunting license holders in 2021: 22.9 per 1,000 people (289,922 total)
- Share of deer harvested with a rifle or shotgun in 2021: 52%
28. Utah

- Population hunting with a firearm in 2021: 13.6 per 1,000 people (45,520 total)
- Paid hunting license holders in 2021: 80.3 per 1,000 people (268,075 total)
- Share of deer harvested with a rifle or shotgun in 2021: 74%
27. Ohio
Source: bryanakers / iStock via Getty Images
- Population hunting with a firearm in 2021: 15.1 per 1,000 people (177,558 total)
- Paid hunting license holders in 2021: 30.6 per 1,000 people (360,421 total)
- Share of deer harvested with a rifle or shotgun in 2021: 44%
26. Iowa
Source: corradobarattaphotos / iStock via Getty Images
- Population hunting with a firearm in 2021: 15.1 per 1,000 people (48,148 total)
- Paid hunting license holders in 2021: 69.1 per 1,000 people (220,576 total)
- Share of deer harvested with a rifle or shotgun in 2021: 62%
25. Delaware

- Population hunting with a firearm in 2021: 15.1 per 1,000 people (15,201 total)
- Paid hunting license holders in 2021: 16.7 per 1,000 people (16,728 total)
- Share of deer harvested with a rifle or shotgun in 2021: 70%
24. Georgia
Source: sebatl / E+ via Getty Images
- Population hunting with a firearm in 2021: 17.4 per 1,000 people (187,797 total)
- Paid hunting license holders in 2021: 71.2 per 1,000 people (769,105 total)
- Share of deer harvested with a rifle or shotgun in 2021: 83%
23. Kansas
Source: ricardoreitmeyer / iStock via Getty Images
- Population hunting with a firearm in 2021: 20.4 per 1,000 people (59,870 total)
- Paid hunting license holders in 2021: 86.9 per 1,000 people (255,143 total)
- Share of deer harvested with a rifle or shotgun in 2021: 50%
22. Tennessee
Source: Thomas Faull / iStock via Getty Images
- Population hunting with a firearm in 2021: 20.6 per 1,000 people (143,381 total)
- Paid hunting license holders in 2021: 104.5 per 1,000 people (728,759 total)
- Share of deer harvested with a rifle or shotgun in 2021: 66%
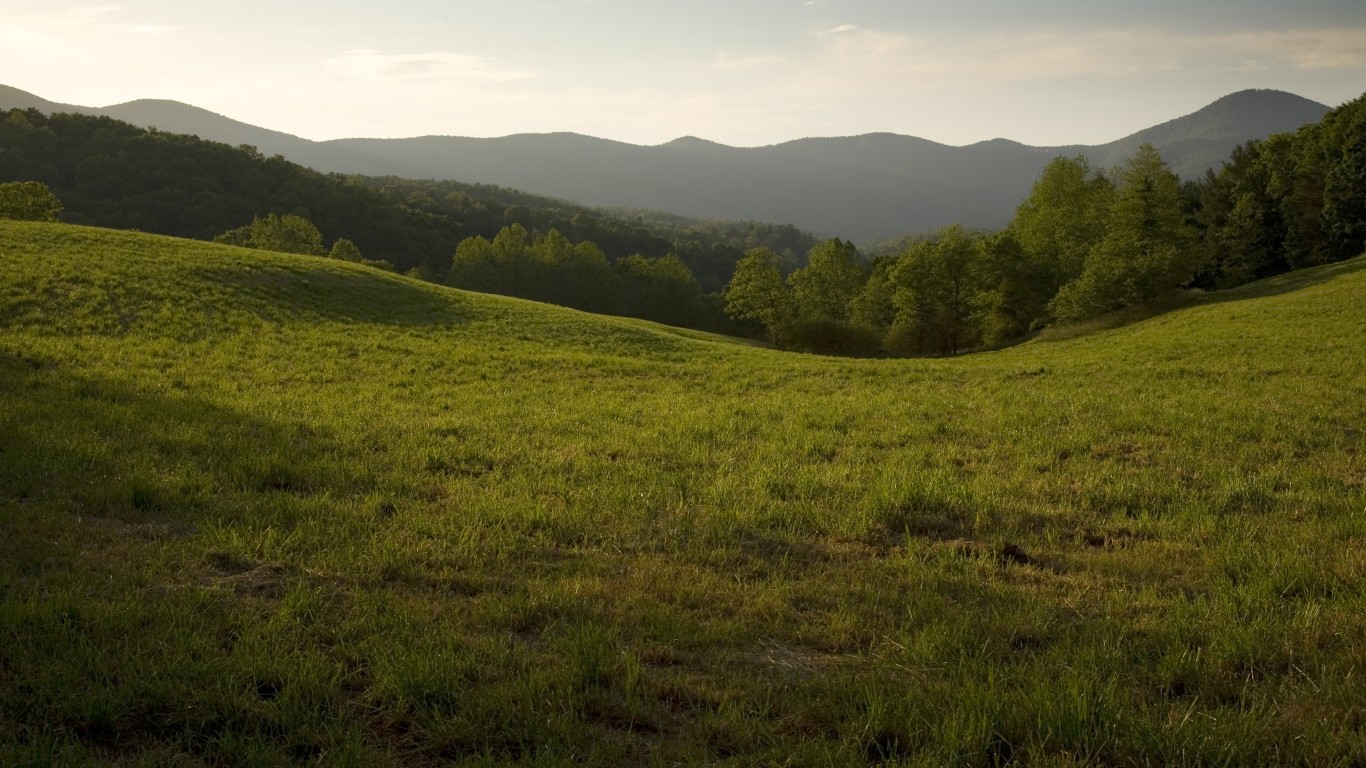
21. Virginia
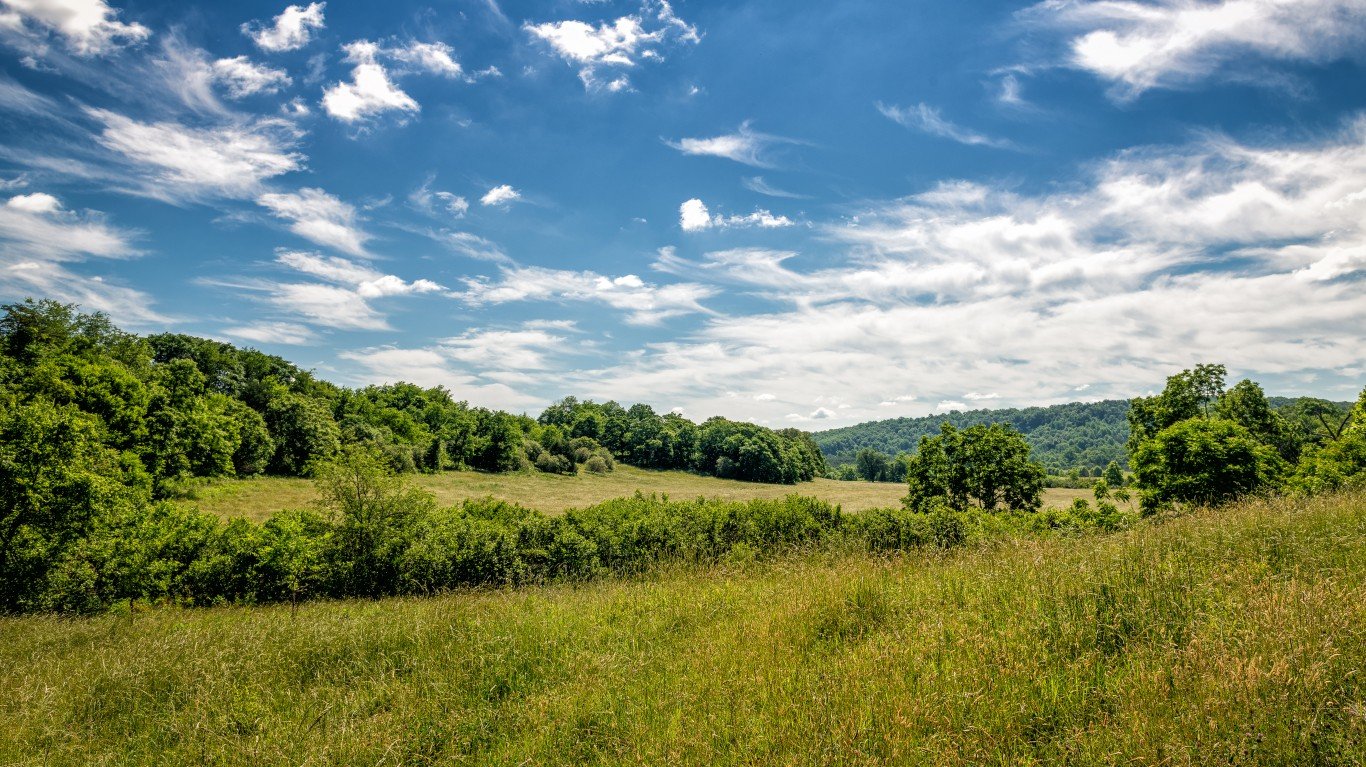
Source: lovingav / iStock via Getty Images
- Population hunting with a firearm in 2021: 21.5 per 1,000 people (185,427 total)
- Paid hunting license holders in 2021: 29.3 per 1,000 people (253,650 total)
- Share of deer harvested with a rifle or shotgun in 2021: 63%
20. Texas

- Population hunting with a firearm in 2021: 23.7 per 1,000 people (700,573 total)
- Paid hunting license holders in 2021: 39.6 per 1,000 people (1,170,316 total)
- Share of deer harvested with a rifle or shotgun in 2021: 87%
19. Oregon
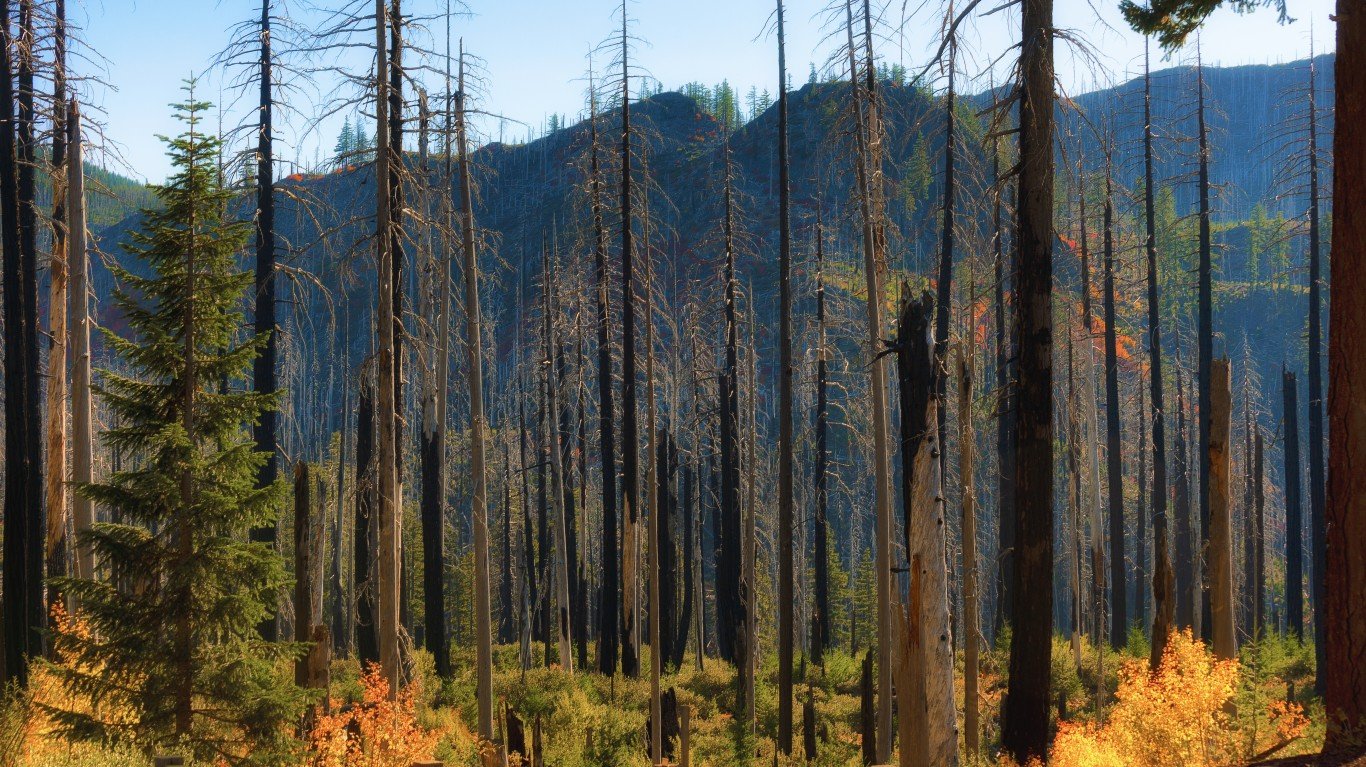
Source: Dee / iStock via Getty Images
- Population hunting with a firearm in 2021: 24.8 per 1,000 people (105,484 total)
- Paid hunting license holders in 2021: 78.1 per 1,000 people (331,475 total)
- Share of deer harvested with a rifle or shotgun in 2021: 88%
18. South Carolina
Source: ericfoltz / E+ via Getty Images
- Population hunting with a firearm in 2021: 25.0 per 1,000 people (129,591 total)
- Paid hunting license holders in 2021: 42.2 per 1,000 people (219,222 total)
- Share of deer harvested with a rifle or shotgun in 2021: 90%
17. New York
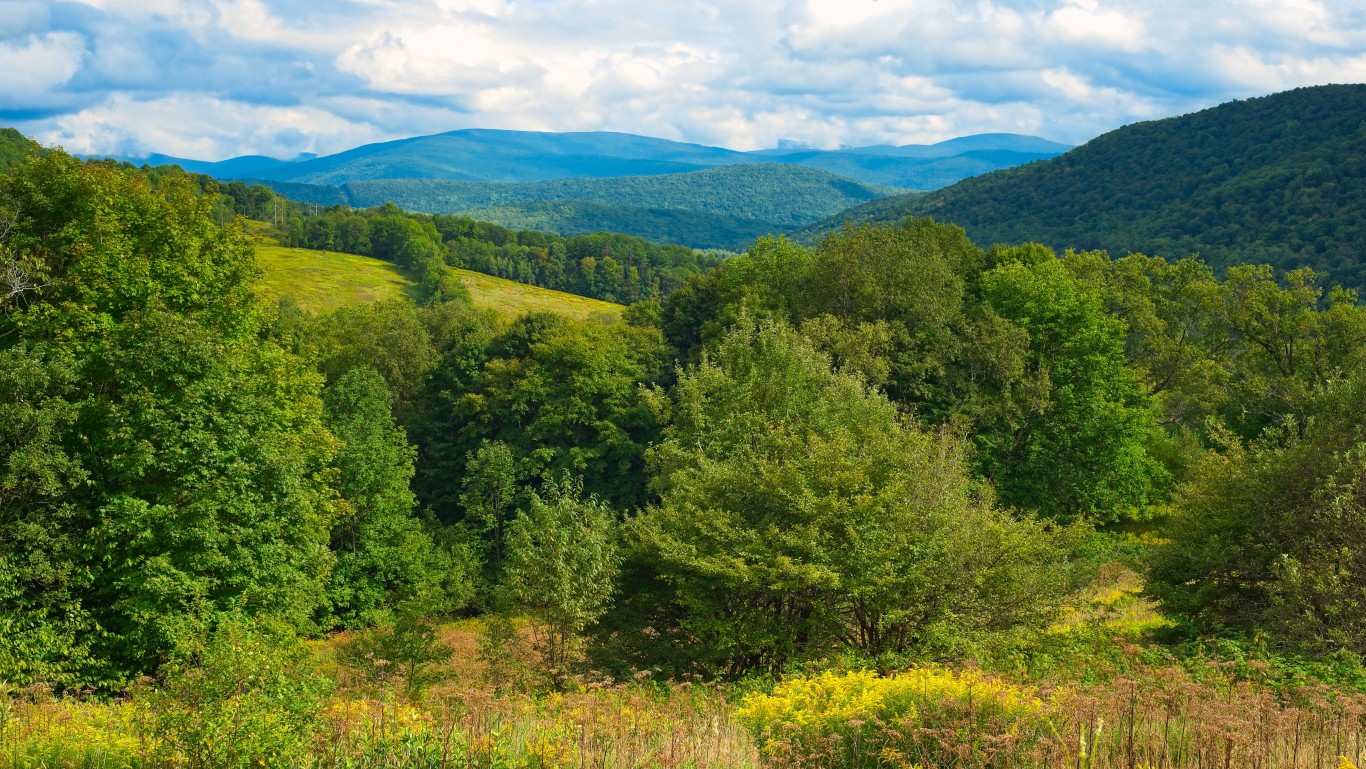
Source: PapaBear / iStock via Getty Images
- Population hunting with a firearm in 2021: 28.5 per 1,000 people (565,629 total)
- Paid hunting license holders in 2021: 28.2 per 1,000 people (560,346 total)
- Share of deer harvested with a rifle or shotgun in 2021: 62%
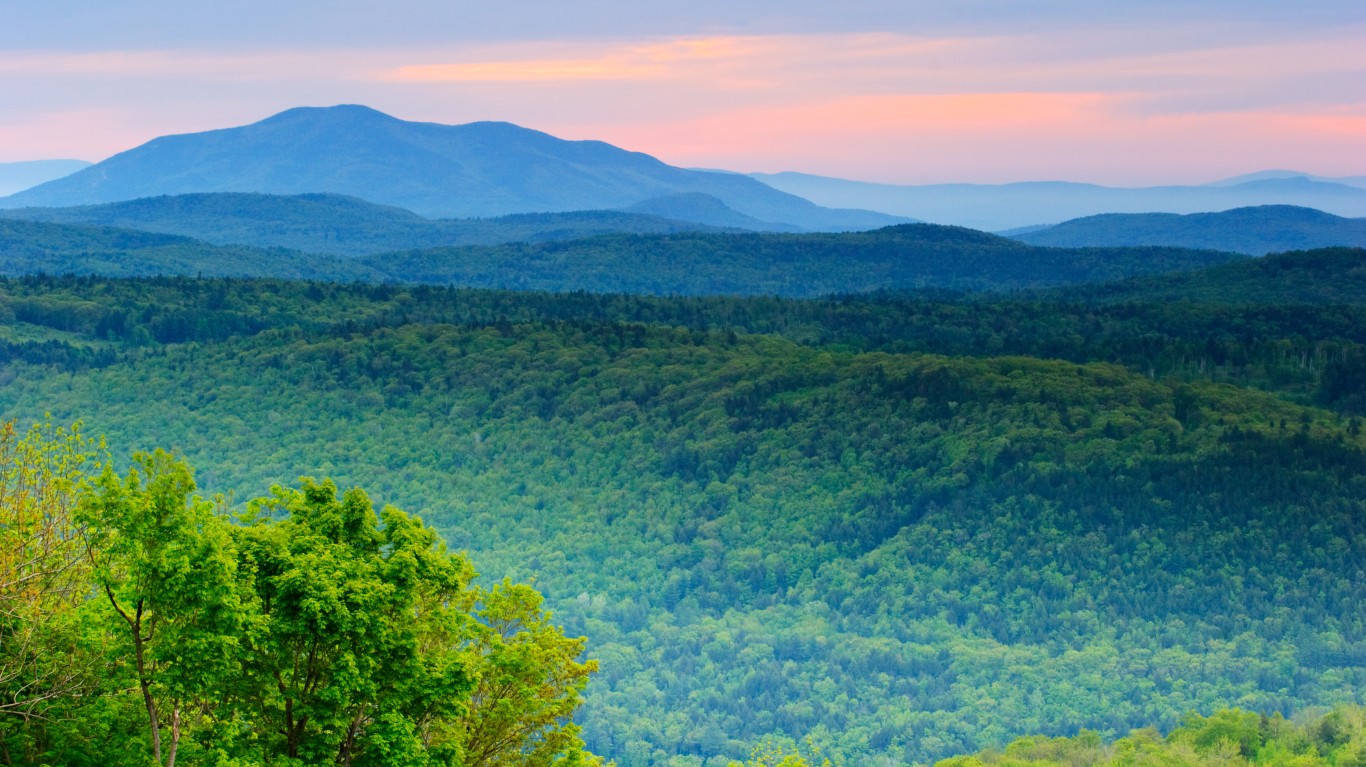
16. New Hampshire

Source: AppalachianViews / iStock via Getty Images
- Population hunting with a firearm in 2021: 40.1 per 1,000 people (55,725 total)
- Paid hunting license holders in 2021: 43.6 per 1,000 people (60,629 total)
- Share of deer harvested with a rifle or shotgun in 2021: 50%
15. Oklahoma
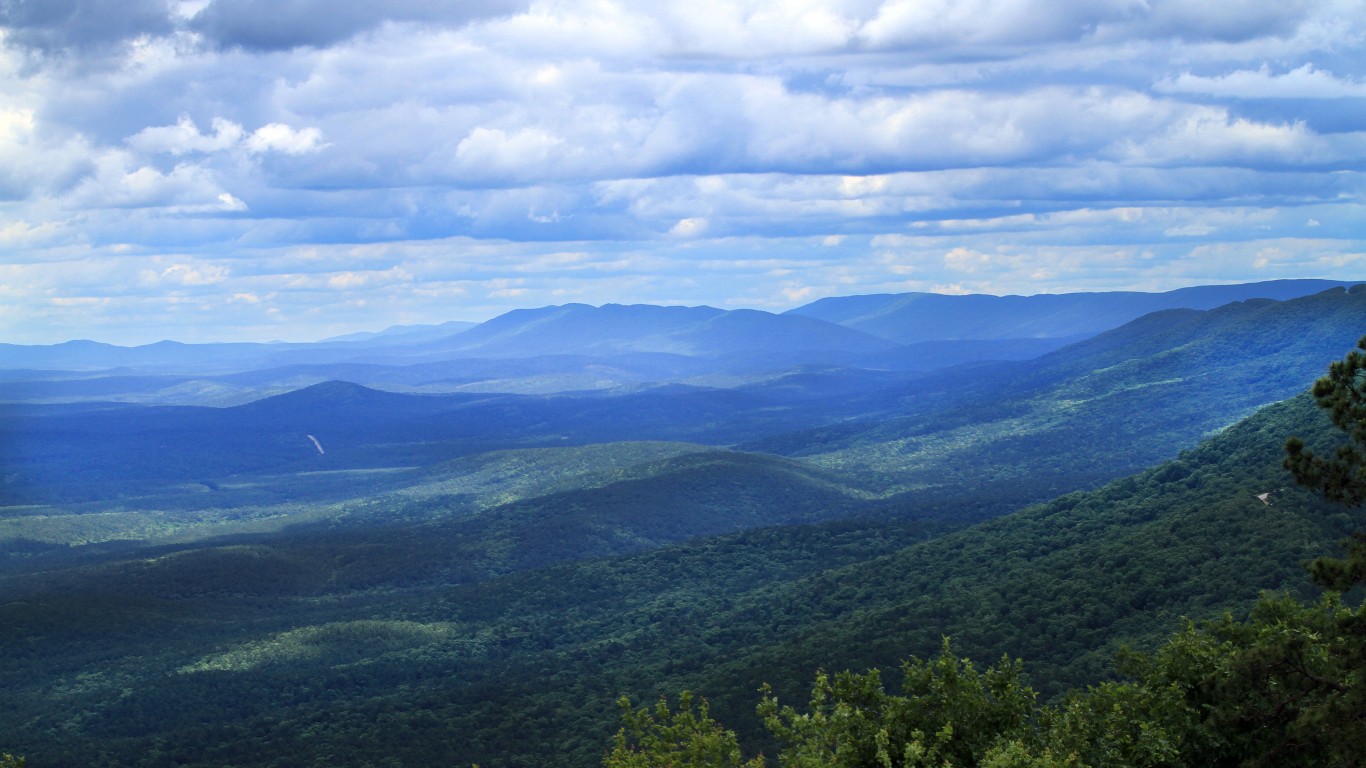
Source: Tamara Harding / Getty Images
- Population hunting with a firearm in 2021: 41.1 per 1,000 people (163,903 total)
- Paid hunting license holders in 2021: 125.2 per 1,000 people (499,182 total)
- Share of deer harvested with a rifle or shotgun in 2021: 59%
14. Nebraska
Source: marekuliasz / iStock via Getty Images
- Population hunting with a firearm in 2021: 41.2 per 1,000 people (81,000 total)
- Paid hunting license holders in 2021: 94.2 per 1,000 people (185,034 total)
- Share of deer harvested with a rifle or shotgun in 2021: 82%
13. Alabama
Source: Richard_Pearlman / iStock via Getty Images
- Population hunting with a firearm in 2021: 42.9 per 1,000 people (216,348 total)
- Paid hunting license holders in 2021: 100.1 per 1,000 people (504,600 total)
- Share of deer harvested with a rifle or shotgun in 2021: 76%
12. Pennsylvania
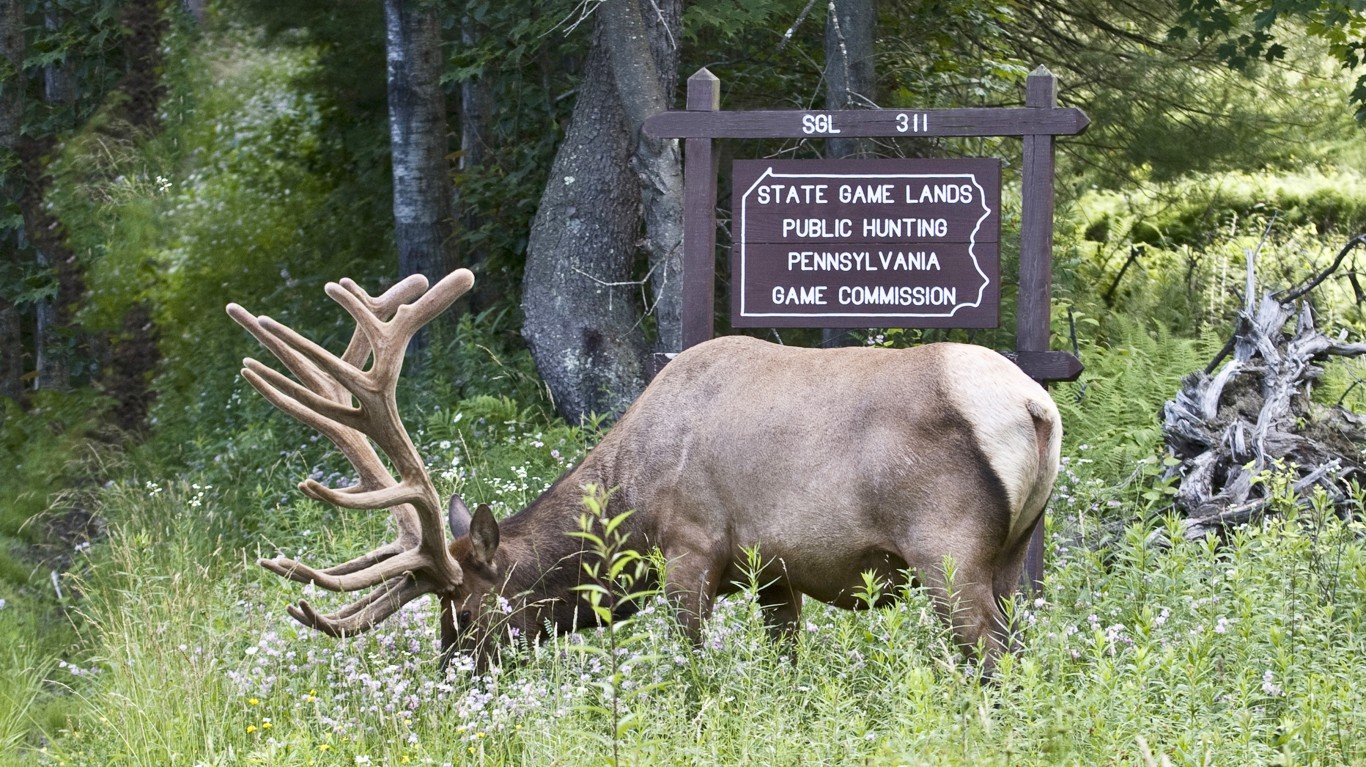
Source: paulsta / iStock via Getty Images
- Population hunting with a firearm in 2021: 43.0 per 1,000 people (558,000 total)
- Paid hunting license holders in 2021: 73.6 per 1,000 people (953,903 total)
- Share of deer harvested with a rifle or shotgun in 2021: 60%
11. Louisiana
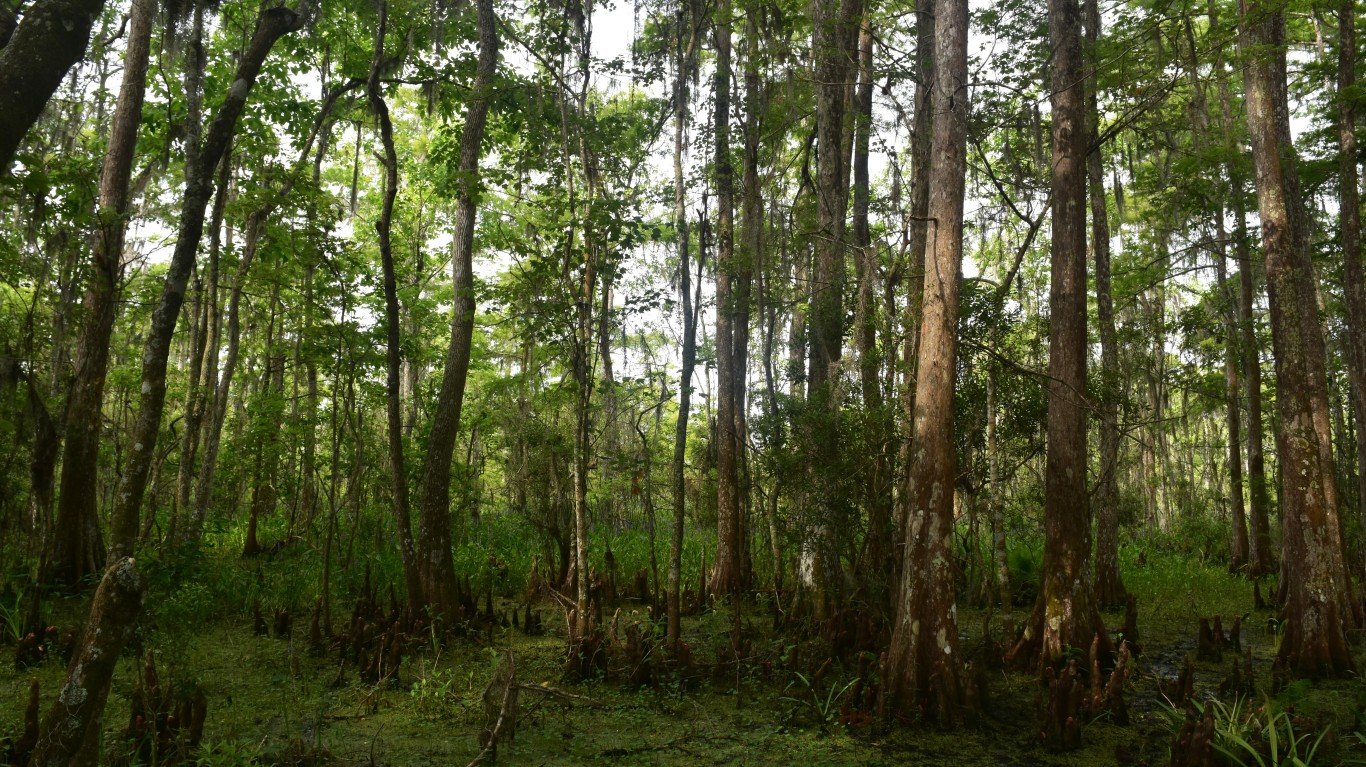
Source: DejaVu Designs / iStock via Getty Images
- Population hunting with a firearm in 2021: 43.1 per 1,000 people (199,300 total)
- Paid hunting license holders in 2021: 95.7 per 1,000 people (442,678 total)
- Share of deer harvested with a rifle or shotgun in 2021: 79%
10. Michigan
Source: Paul Massie Photography / iStock via Getty Images
- Population hunting with a firearm in 2021: 46.1 per 1,000 people (463,178 total)
- Paid hunting license holders in 2021: 65.8 per 1,000 people (660,933 total)
- Share of deer harvested with a rifle or shotgun in 2021: 62%
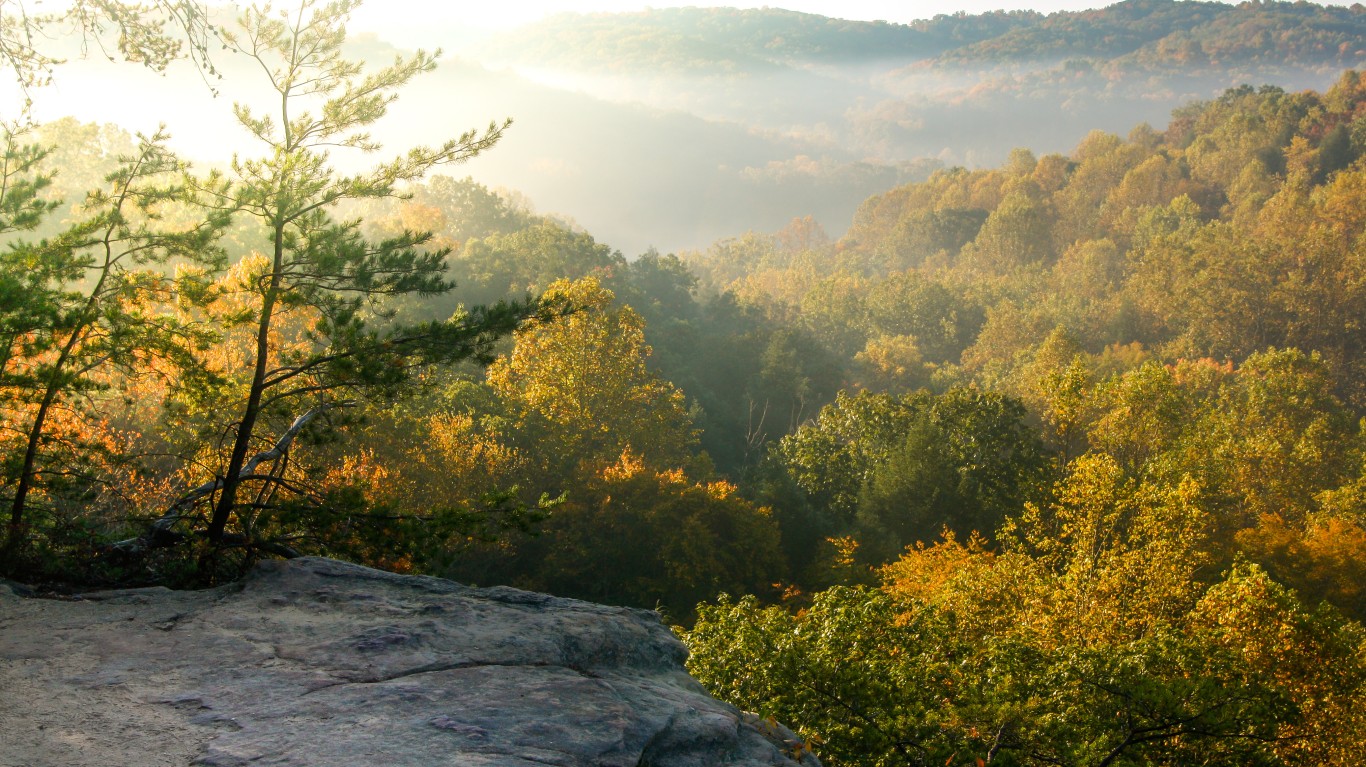
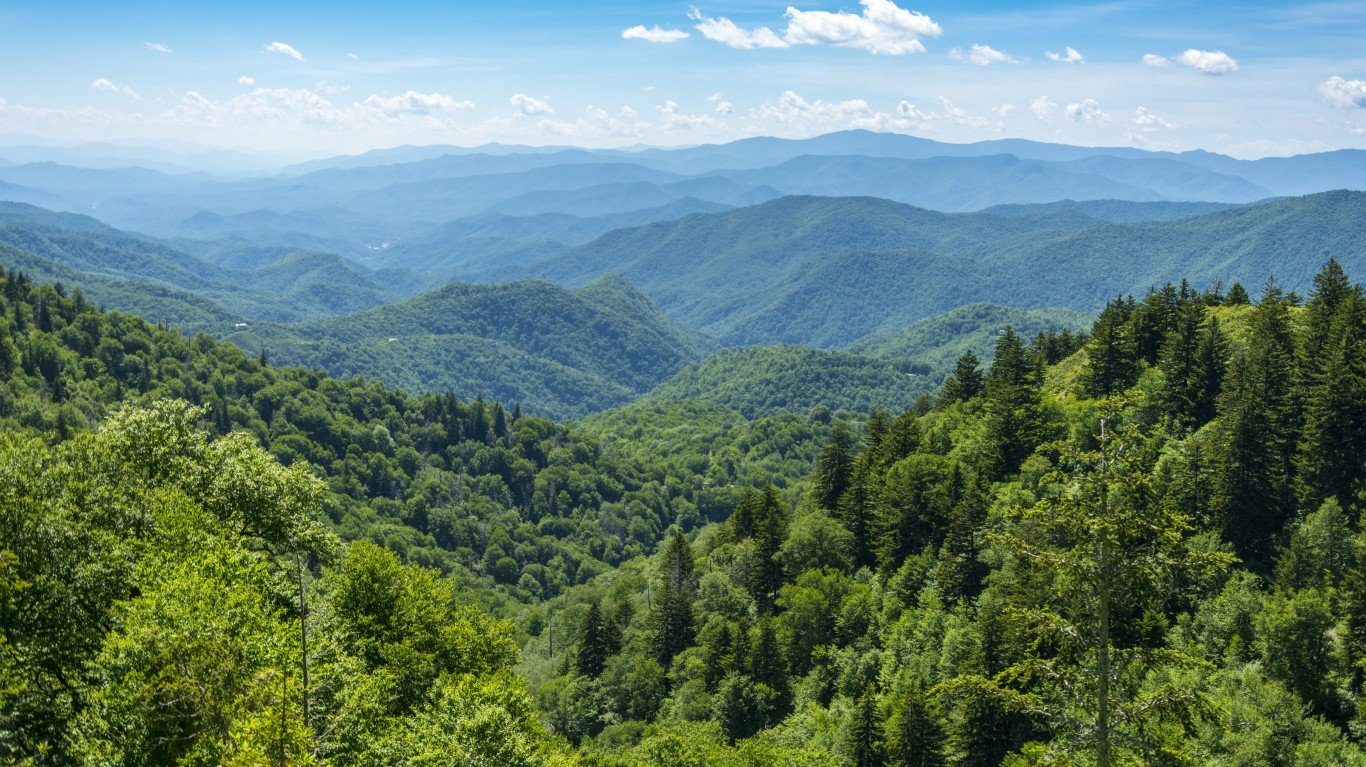
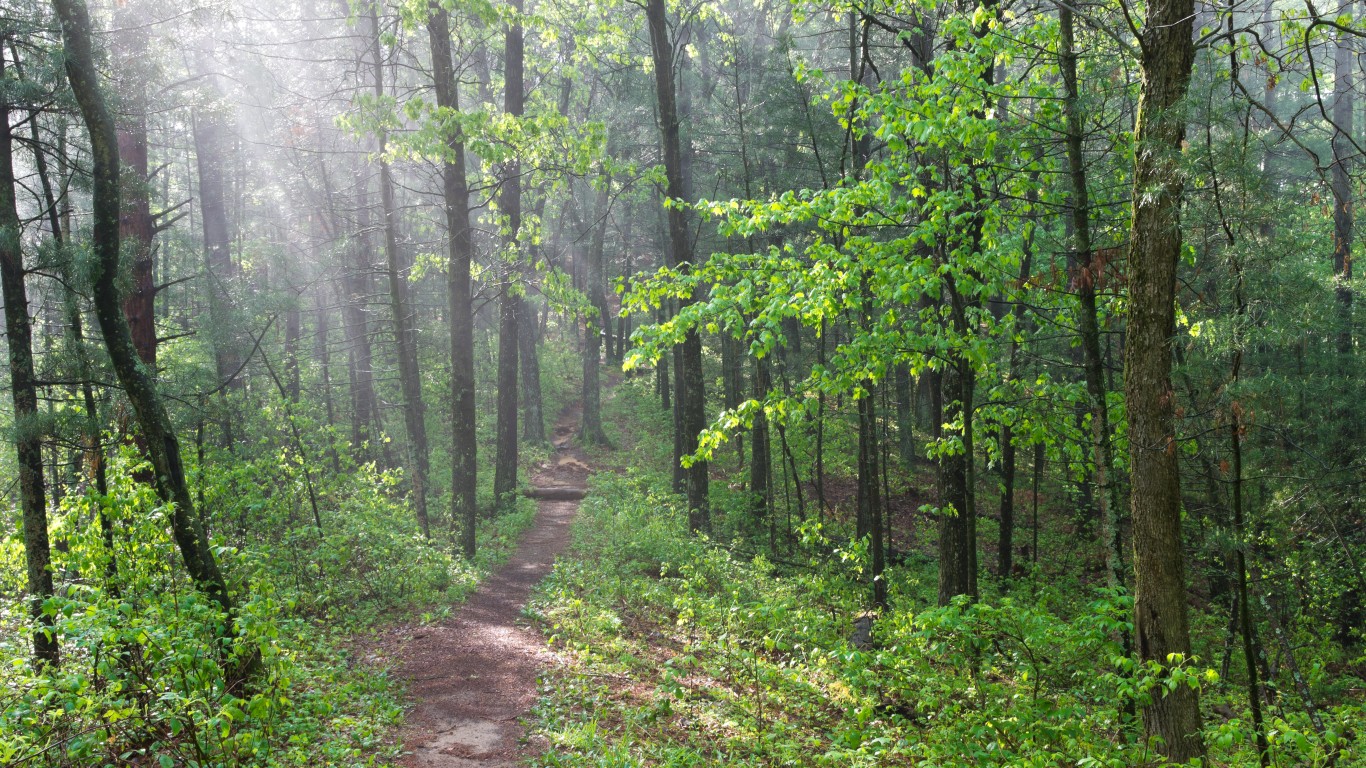
9. Kentucky
Source: Thomas Kelley / iStock via Getty Images
- Population hunting with a firearm in 2021: 48.3 per 1,000 people (217,603 total)
- Paid hunting license holders in 2021: 71.3 per 1,000 people (321,347 total)
- Share of deer harvested with a rifle or shotgun in 2021: 73%
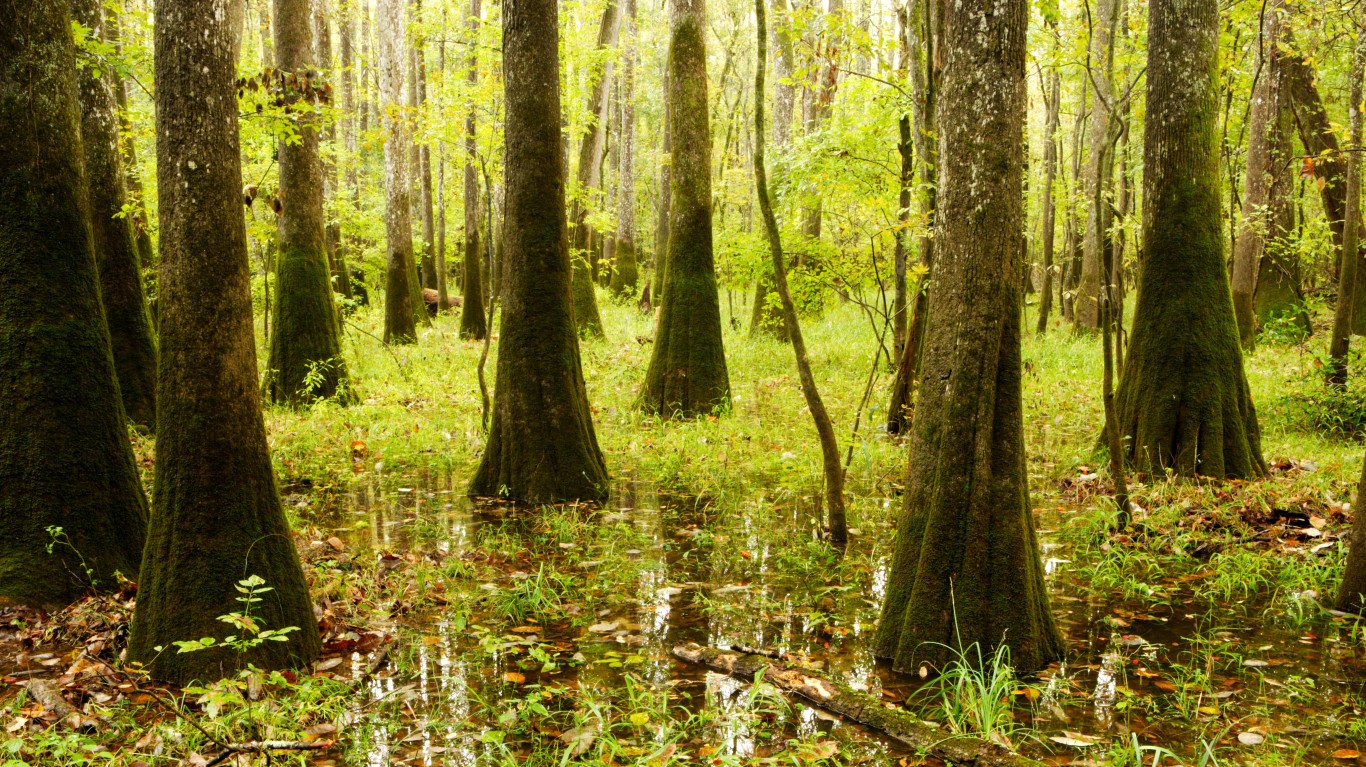
8. Mississippi
Source: Michael Treglia / iStock via Getty Images
- Population hunting with a firearm in 2021: 61.2 per 1,000 people (180,665 total)
- Paid hunting license holders in 2021: 95.9 per 1,000 people (283,021 total)
- Share of deer harvested with a rifle or shotgun in 2021: 73%
7. Missouri
Source: eyecrave productions / iStock via Getty Images
- Population hunting with a firearm in 2021: 72.1 per 1,000 people (444,990 total)
- Paid hunting license holders in 2021: 82.7 per 1,000 people (509,963 total)
- Share of deer harvested with a rifle or shotgun in 2021: 76%
6. Minnesota
Source: Willard / iStock via Getty Images
- Population hunting with a firearm in 2021: 73.1 per 1,000 people (417,186 total)
- Paid hunting license holders in 2021: 96.5 per 1,000 people (550,663 total)
- Share of deer harvested with a rifle or shotgun in 2021: 81%
5. North Dakota

Source: corradobarattaphotos / iStock via Getty Images
- Population hunting with a firearm in 2021: 79.5 per 1,000 people (61,574 total)
- Paid hunting license holders in 2021: 194.5 per 1,000 people (150,724 total)
- Share of deer harvested with a rifle or shotgun in 2021: 80%
4. Wyoming
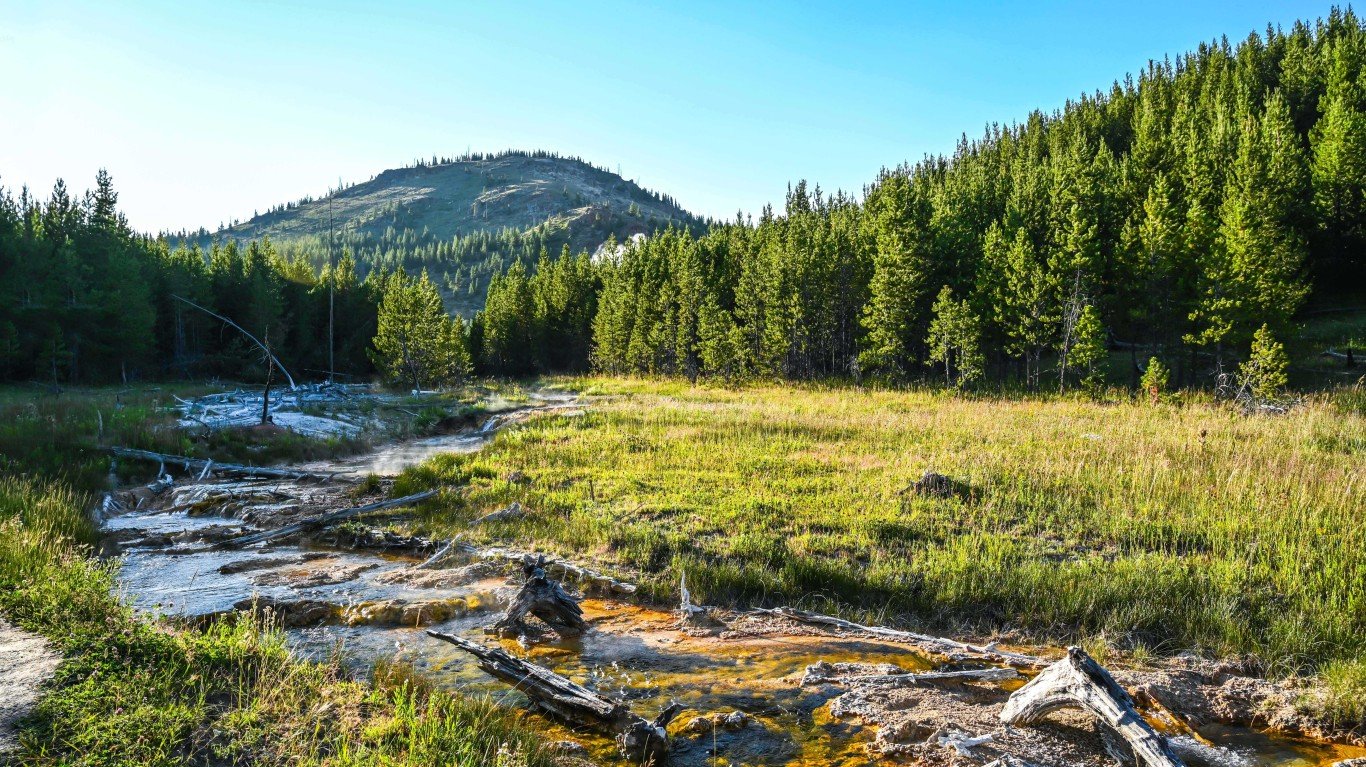
Source: Cheri Alguire / iStock via Getty Images
- Population hunting with a firearm in 2021: 94.7 per 1,000 people (54,819 total)
- Paid hunting license holders in 2021: 235.3 per 1,000 people (136,205 total)
- Share of deer harvested with a rifle or shotgun in 2021: 93%
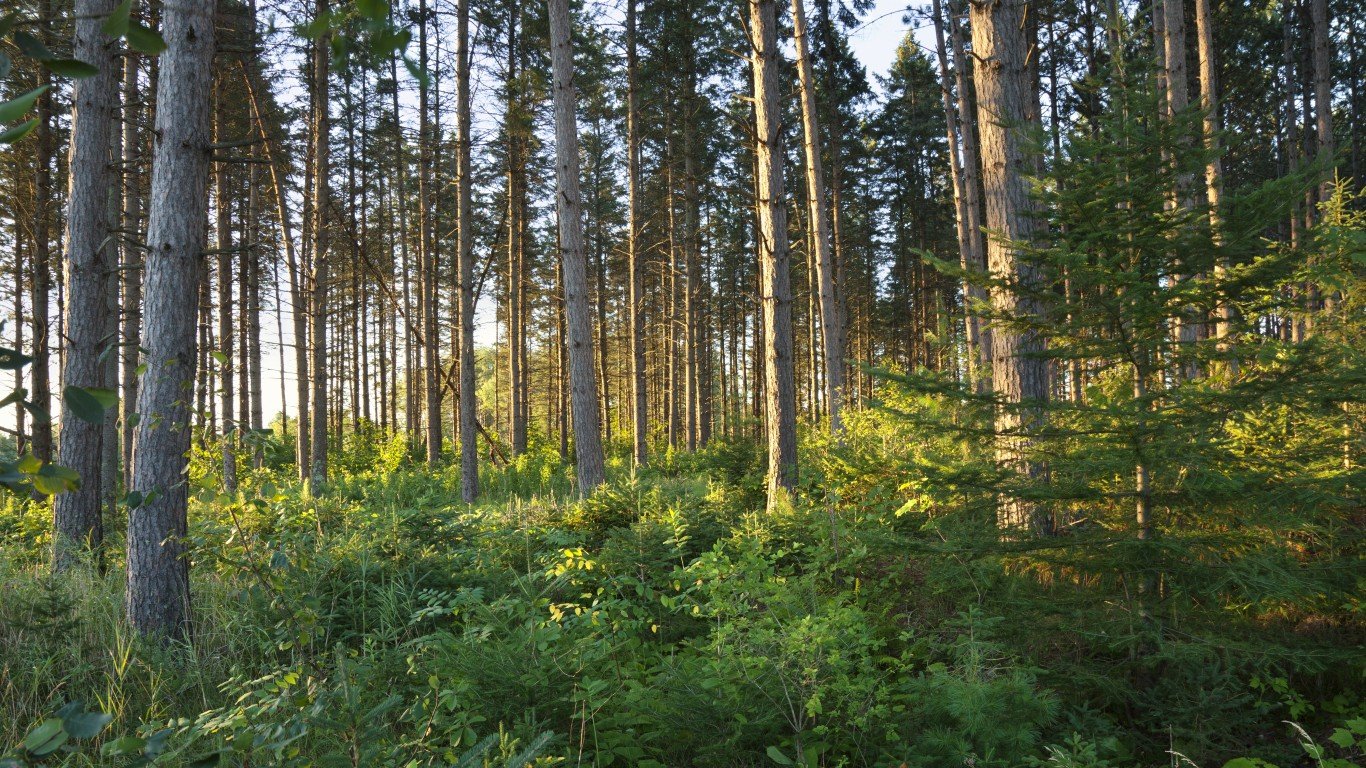
3. Wisconsin
Source: jferrer / iStock via Getty Images
- Population hunting with a firearm in 2021: 96.0 per 1,000 people (565,909 total)
- Paid hunting license holders in 2021: 113.6 per 1,000 people (669,813 total)
- Share of deer harvested with a rifle or shotgun in 2021: 66%
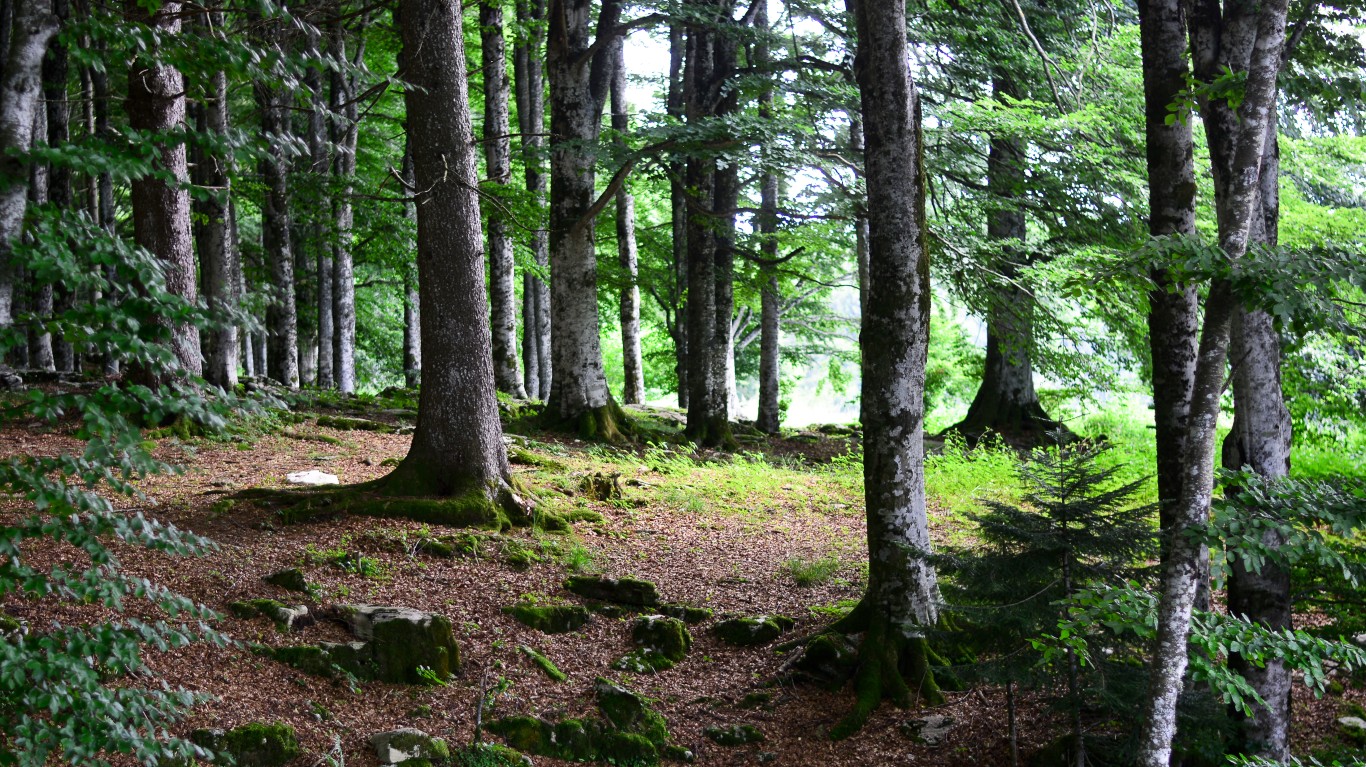
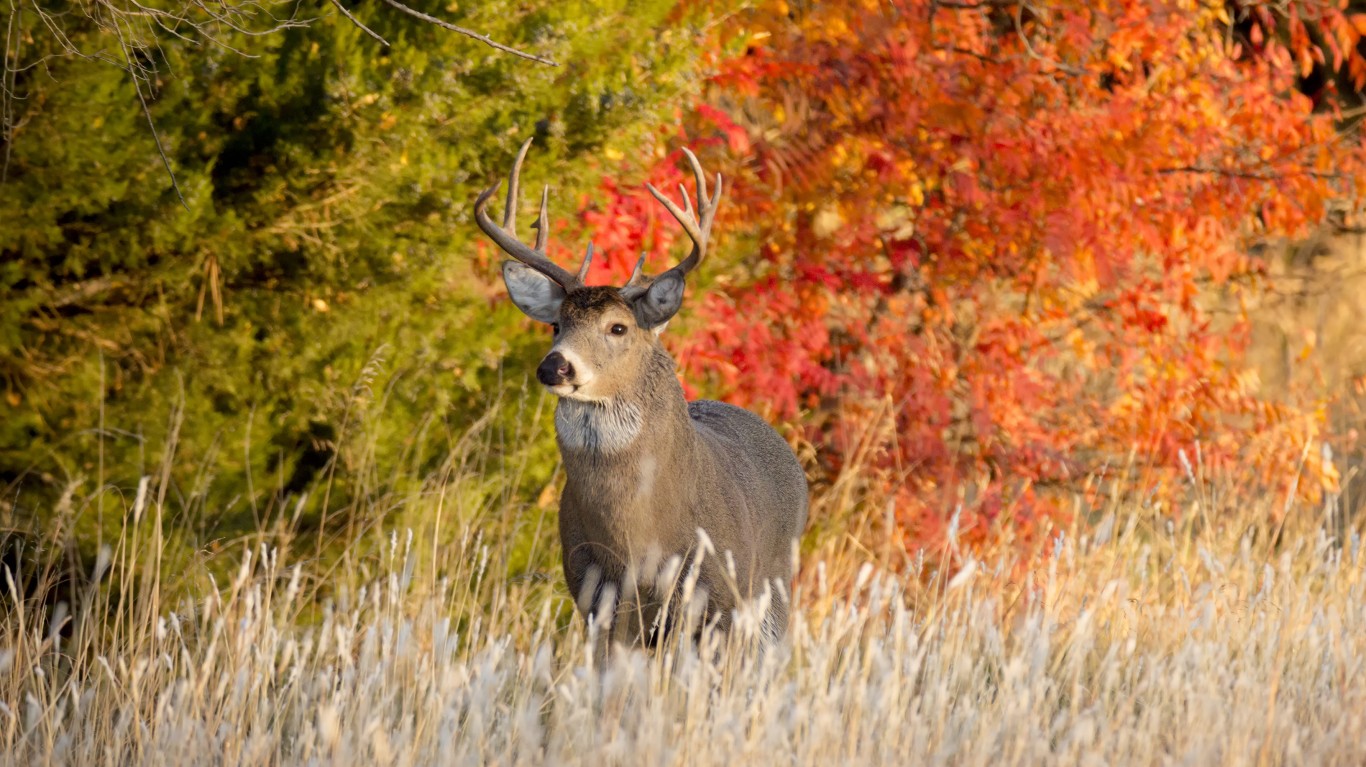
2. Vermont
Source: KenCanning / E+ via Getty Images
- Population hunting with a firearm in 2021: 126.7 per 1,000 people (81,793 total)
- Paid hunting license holders in 2021: 99.7 per 1,000 people (64,343 total)
- Share of deer harvested with a rifle or shotgun in 2021: 51%
1. Maine
Source: JZHunt / iStock via Getty Images
- Population hunting with a firearm in 2021: 131.8 per 1,000 people (180,900 total)
- Paid hunting license holders in 2021: 151.5 per 1,000 people (207,849 total)
- Share of deer harvested with a rifle or shotgun in 2021: 87%
ALERT: Take This Retirement Quiz Now (Sponsored)
Take the quiz below to get matched with a financial advisor today.
Each advisor has been vetted by SmartAsset and is held to a fiduciary standard to act in your best interests.
Here’s how it works:
1. Answer SmartAsset advisor match quiz
2. Review your pre-screened matches at your leisure. Check out the advisors’ profiles.
3. Speak with advisors at no cost to you. Have an introductory call on the phone or introduction in person and choose whom to work with in the future
Take the retirement quiz right here.
Thank you for reading! Have some feedback for us?
Contact the 24/7 Wall St. editorial team.
Editors' Picks