The United States has more than 331 million people. These numbers typically rise and fall for a variety of reasons – emigration within the country, moving abroad, higher death rates, and low birth rates to name a few. While some areas are more populous than others, several cities have seen their numbers drop significantly. According to the United States Census Bureau, the rate of population decline has slowed in 2023, with a loss of 14,422 people, compared to 2022 when there was a loss of 42,580 people.
During the COVID-19 pandemic, the U.S. population grew by just 0.1% in 2021, the smallest growth in the nation’s history. It hadn’t rebounded much by 2022, with only a slight growth of 0.4%. Even though experts point to COVID-19 as a major reason for such historically poor growth, the last two years are merely the lowest point in a trend that has lasted for decades.
At certain points in U.S. history, the population experienced a boom in growth. From 1946 to 1964, it is estimated that around 76 million babies were added to the population, which was an increase of more than 50 percent. This time was also known as the baby boom, with children of this era referred to as baby boomers.
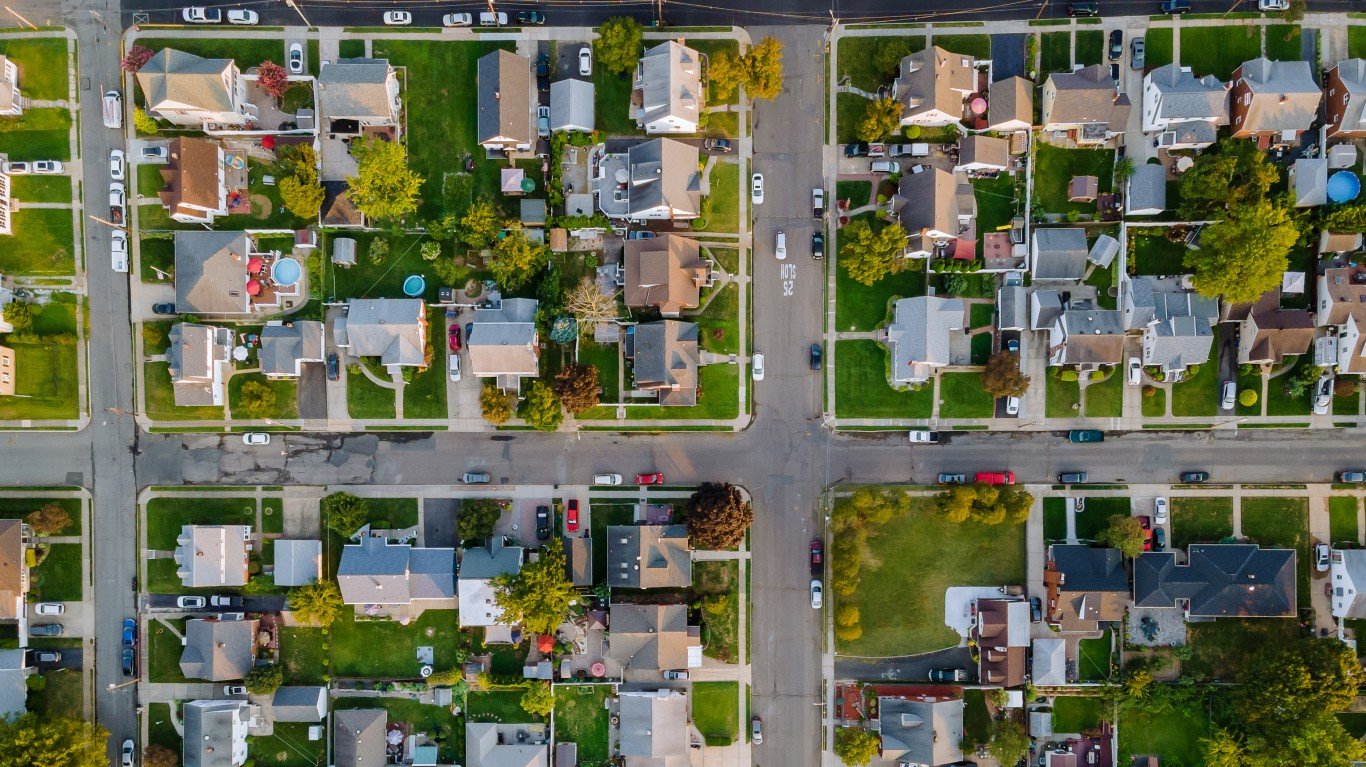
Since then, growth has slowed, except for a small surge in the 1990s. Another trend has accompanied the national population decline: the loss of tens of thousands, sometimes hundreds of thousands of residents every decade, in some of the nation’s largest cities because of economic and demographic changes. Cities that were once among the nation’s largest metropolises have now become shadows of their former selves.
To identify the major U.S. cities that lost more than half their populations, 24/7 Wall St. compared historical editions of the U.S. Census Bureau’s decennial census, starting with 1950, to the most recent available population figures from the Census. We listed all seven cities that were within the 100 most populous cities in the U.S. in 1950 and have lost more than half of their populations as of July 2021.
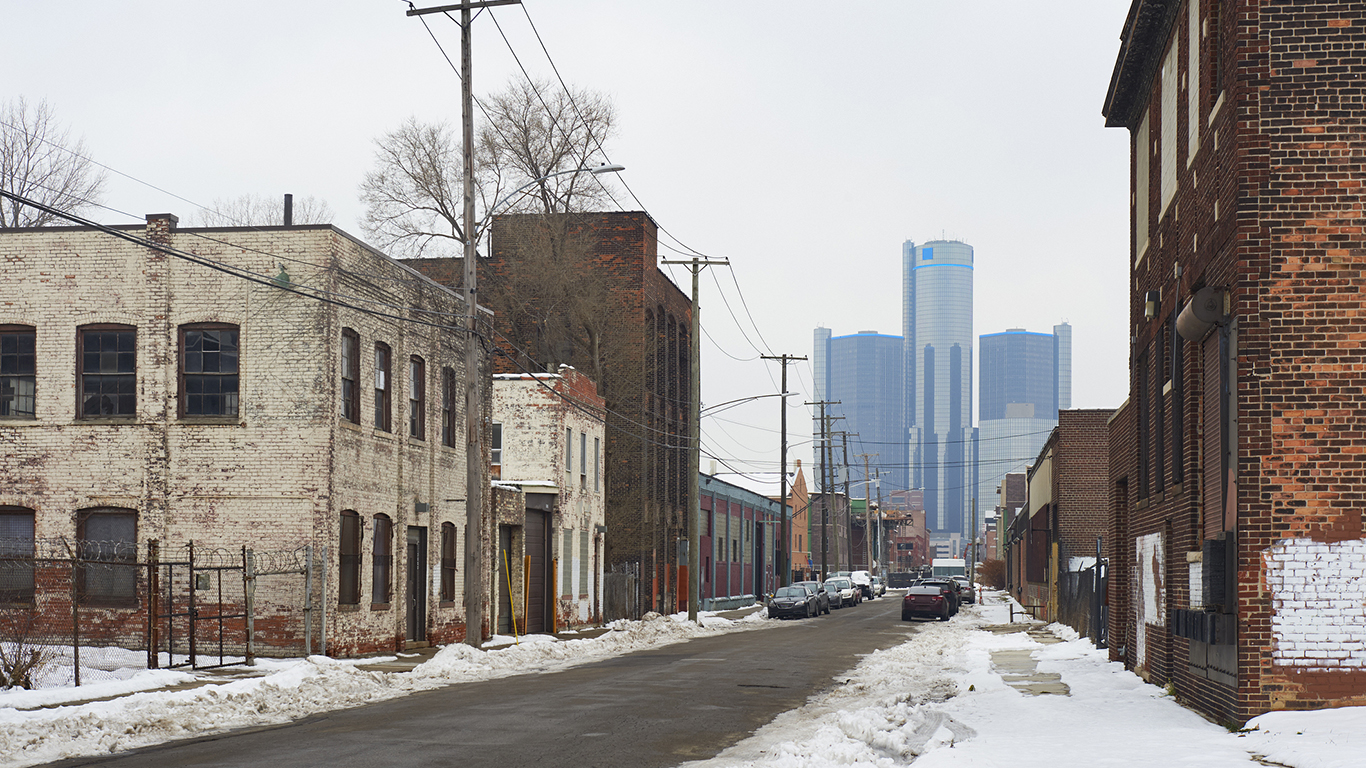
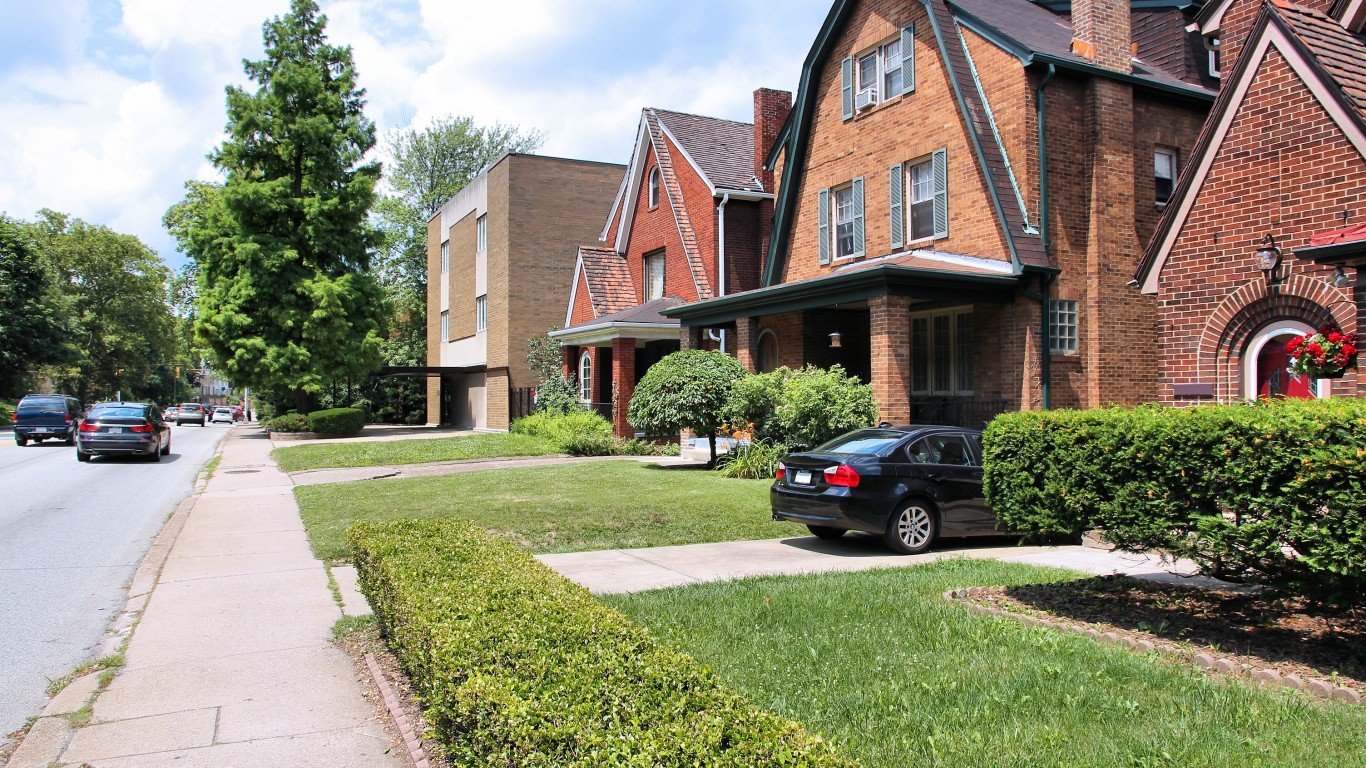
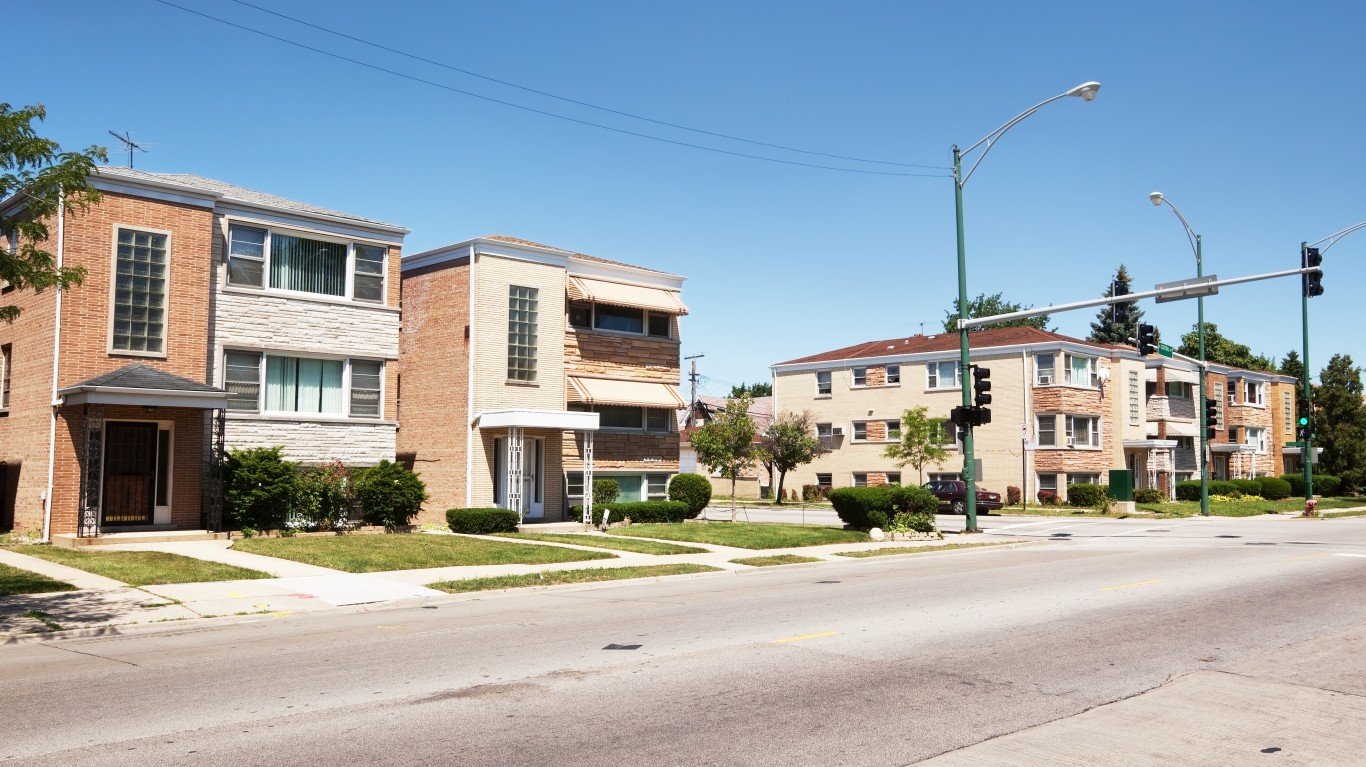
Many of the cities listed are rather well-known locations, including Detroit, St. Louis, and Pittsburgh. These regions are former hubs of American industrial manufacturing, especially automobile manufacturing, and the production of materials, notably steel. The industries that made these cities some of the largest in the country began to show a nationwide decline in the 1970s. More automation and a reduction in the labor force were implemented, and many manufacturers also began outsourcing labor to facilities overseas, where cheaper labor could be obtained. (Here are The World’s Nations With 100 Million People or More.)
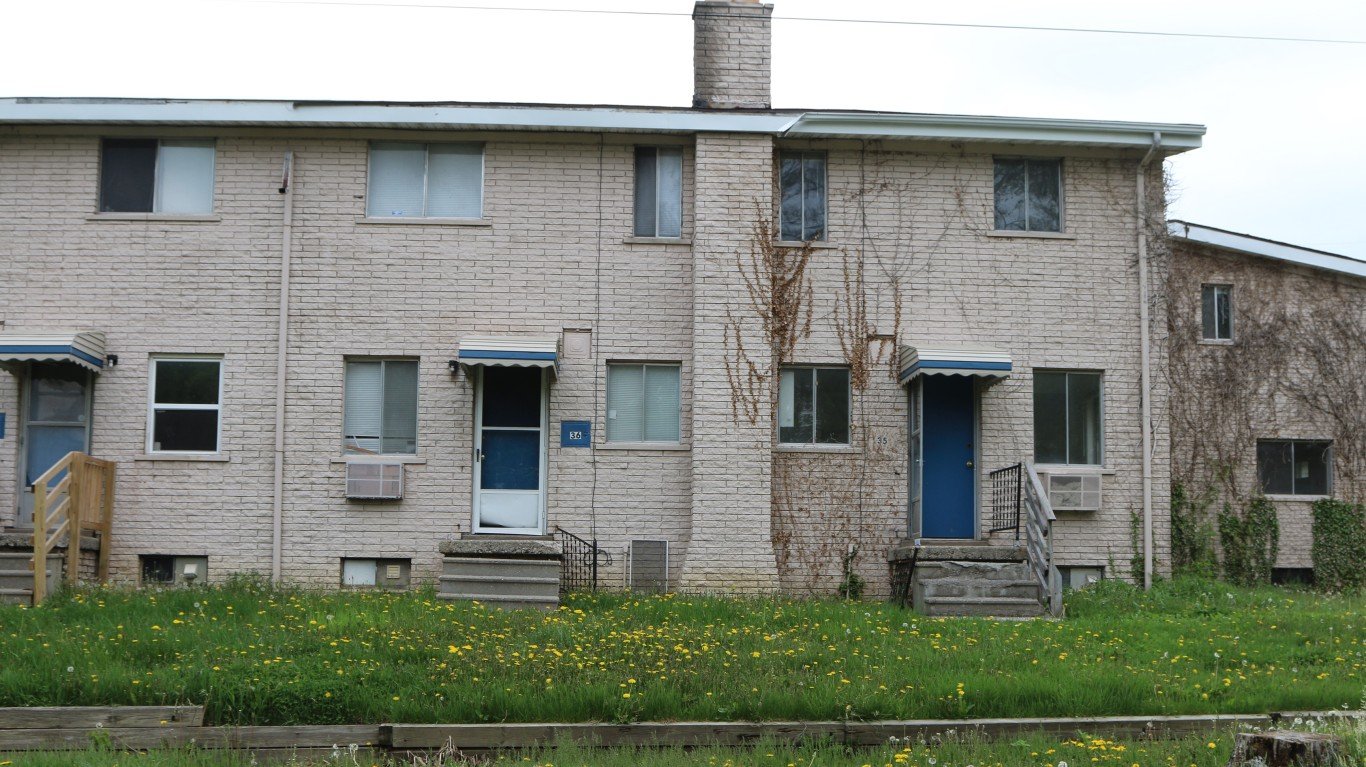
As a result of economic shifts and rising rents, the residents who remain in these cities are more likely to struggle to find work and live in poverty. The rates of SNAP (formerly food stamps) recipients in these cities range from 17.7% in Pittsburgh to nearly 40% in Flint. Several of these cities are among the hardest-hit communities in the nation’s ongoing opioid epidemic. (These are the American cities that declined from wealth into poverty.)
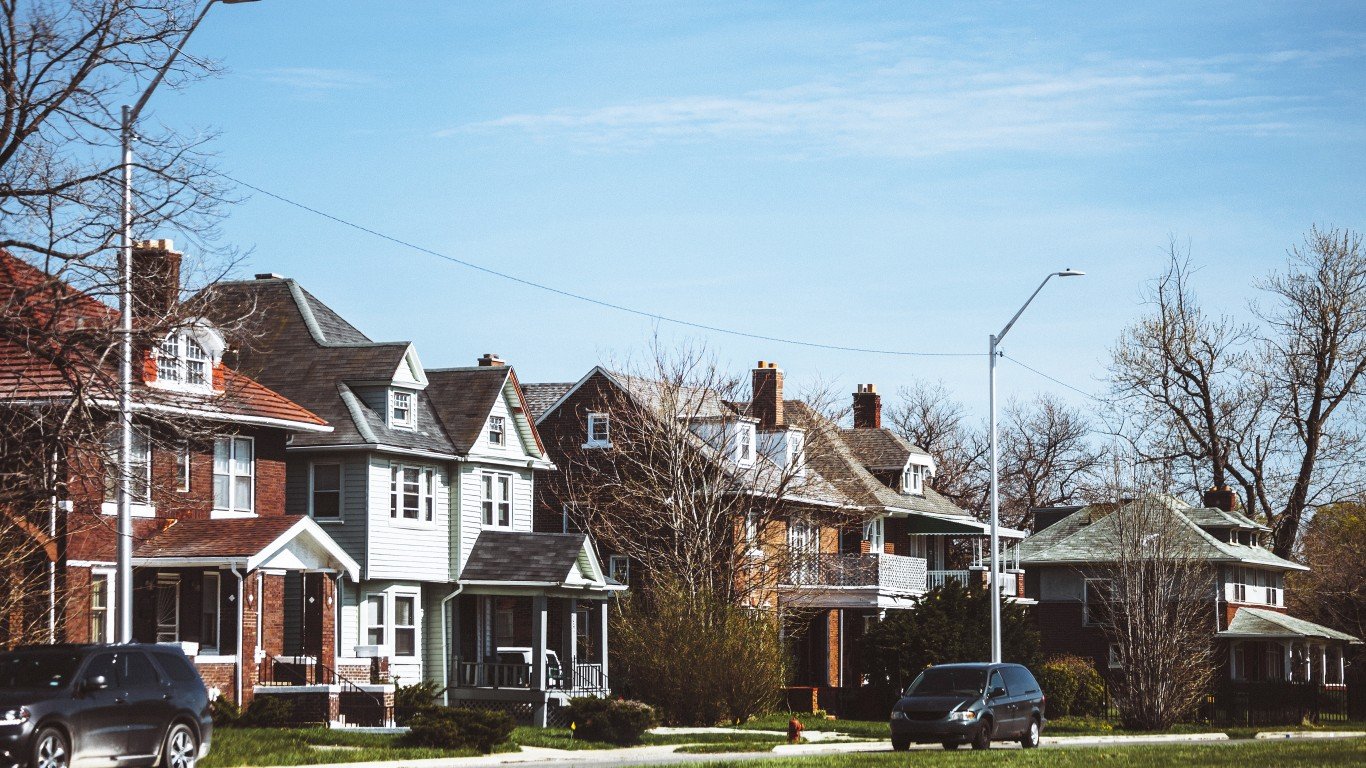
Many demographics contribute to the population decline in these cities, not simply job loss. Several of these cities also went through white flight, where more affluent white residents left urban areas for suburbs. Across the United States, 12.2% of residents are black, but all the cities on this list have a higher share of Black residents. In five, at least 40% of the population is black, and in one, Detroit, 77.5% of residents are Black, while just 10.1% are white.
A history of segregation and discrimination, including housing discrimination in these cities, has left a legacy of racial economic inequality. Black residents earn far less than white residents in these cities. In St. Louis, the median income for black households is $30,947 a year, compared to the median income for white St. Louis households of $64,989.
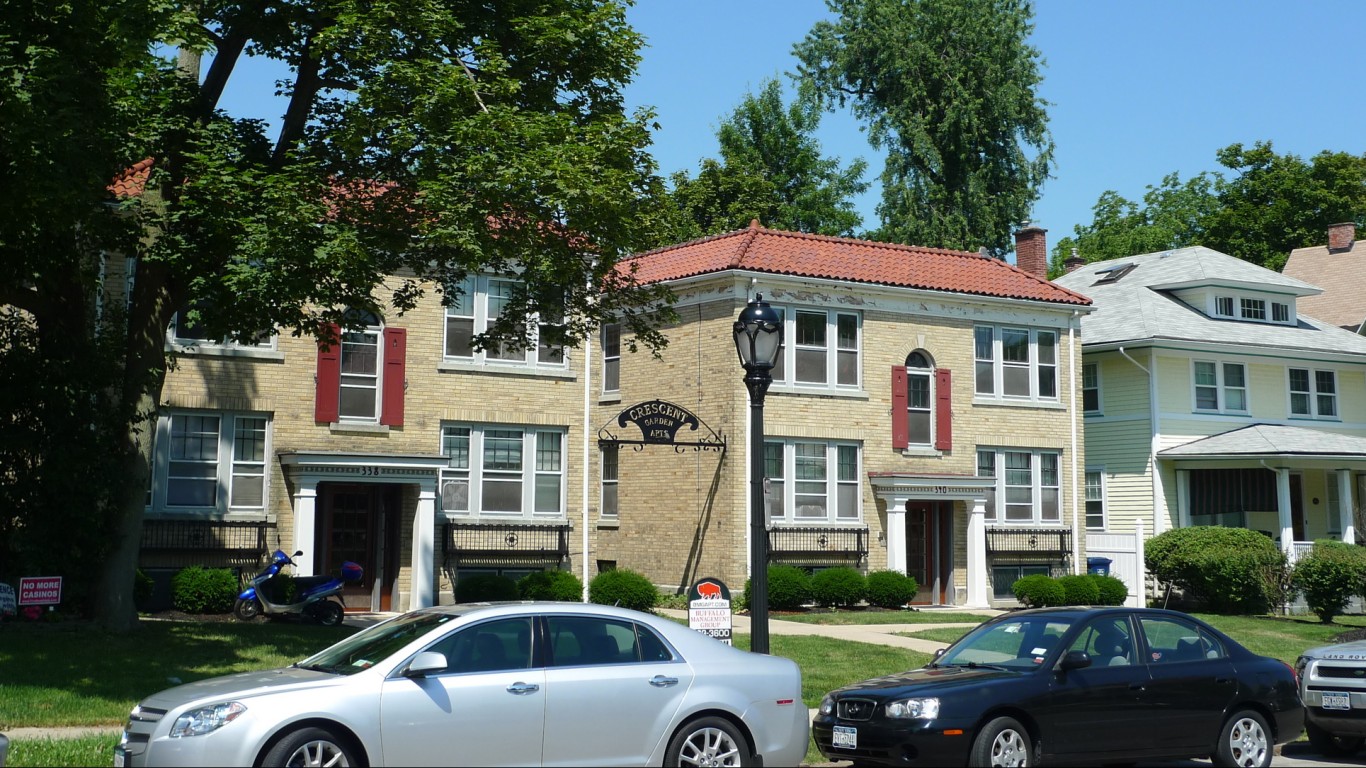
The local governments of the cities listed have attempted to revitalize impoverished neighborhoods by offering relatively cheap homes and commercial real estate to prospective young professionals and businesses. Buffalo, New York, has had some success with its revitalization efforts, and the city’s population increased between 2010 and 2020. It remains to be seen if these seven cities and others like them can ever return to something like their former glory.
Here are major U.S. cities that lost half their populations.
7. Flint, Michigan
- Population decline, 1950-2021: -50.6% (-82,515)
- 2021 population: 80,628 — #463 largest
- 1950 population: 163,143 — #60 largest
- Largest decade population loss: 1970s: -33,706 (-17.4%)
6. Buffalo, New York
- Population decline, 1950-2021: -52.3% (-303,325)
- 2021 population: 276,807 — #78 largest
- 1950 population: 580,132 — #15 largest
- Largest decade population loss: 1970s: -104,898 (-22.7%)
5. Pittsburgh, Pennsylvania
- Population decline, 1950-2021: -55.6% (-376,275)
- 2021 population: 300,431 — #68 largest
- 1950 population: 676,806 — #12 largest
- Largest decade population loss: 1970s: -96,179 (-18.5%)
4. Cleveland, Ohio
- Population decline, 1950-2021: -59.8% (-546,817)
- 2021 population: 367,991 — #54 largest
- 1950 population: 914,808 — #7 largest
- Largest decade population loss: 1970s: -177,081 (-23.6%)
3. Youngstown, Ohio

- Population decline, 1950-2021: -64.2% (-108,060)
- 2021 population: 60,270 — # 643 largest
- 1950 population: 168,330 — #57 largest
- Largest decade population loss: 1960s: -26,901 (-16.1%)
2. St. Louis, Missouri
- Population decline, 1950-2021: -65.8% (-563,486)
- 2021 population: 293,310 — #70 largest
- 1950 population: 856,796 — #8 largest
- Largest decade population loss: 1970s: -169,151 (-27.2%)
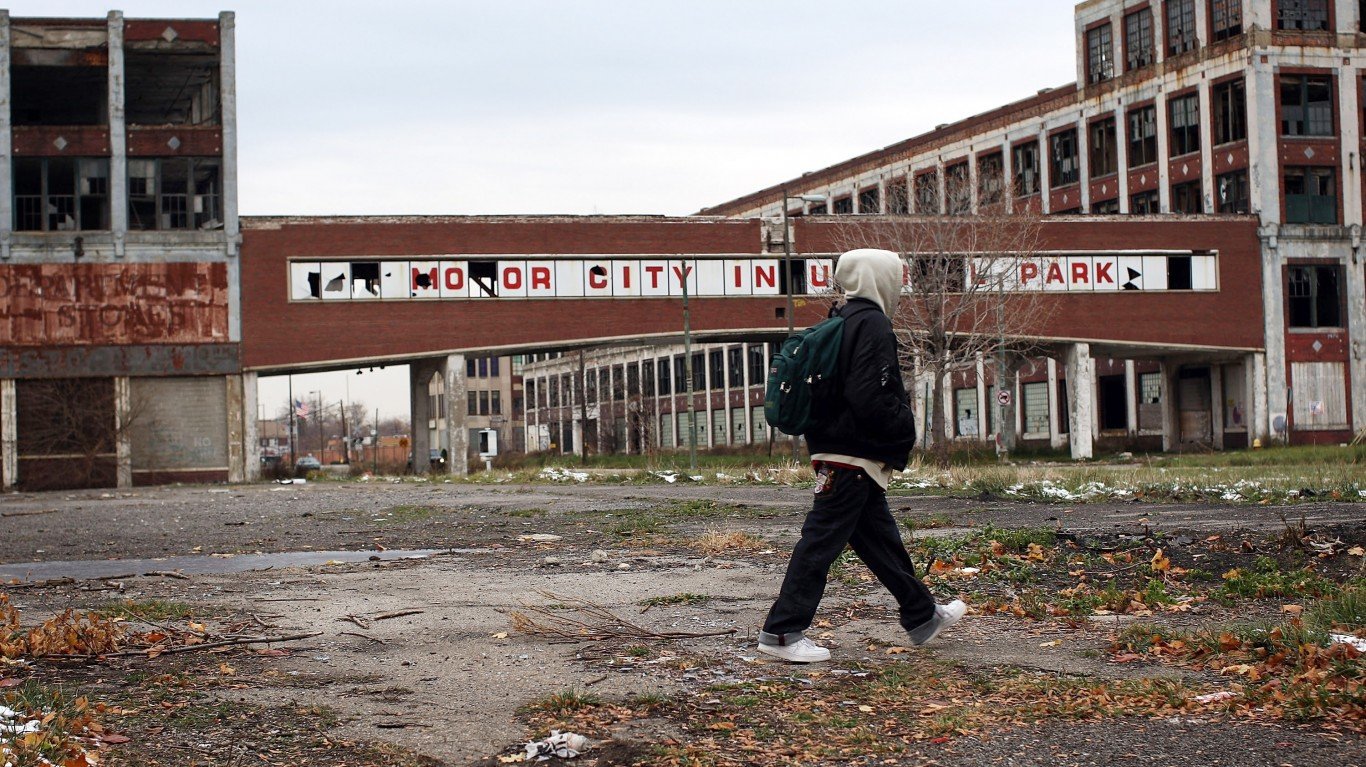
1. Detroit, Michigan
- Population decline, 1950-2021: -65.8% (-1,217,104)
- 2021 population: 632,464 — #27 largest
- 1950 population: 1,849,568 — #5 largest
- Largest decade population loss: 1970s: -308,143 (-20.4%)
Methodology
To identify the cities that have lost more than half of their populations, 24/7 Wall St. compared historical editions of the U.S. Census Bureau’s decennial census, starting with 1950, to the most recent available population figures from the Census Bureau’s Population and Housing Unit Estimates. We listed all seven cities that were within the 100 most populous cities in the U.S. in 1950, which have lost more than half of their populations as of July 2021. The decade with the largest population loss represents the decade with the largest numerical decline in population, not the largest percent decline.
Contact [email protected] for any questions or corrections.