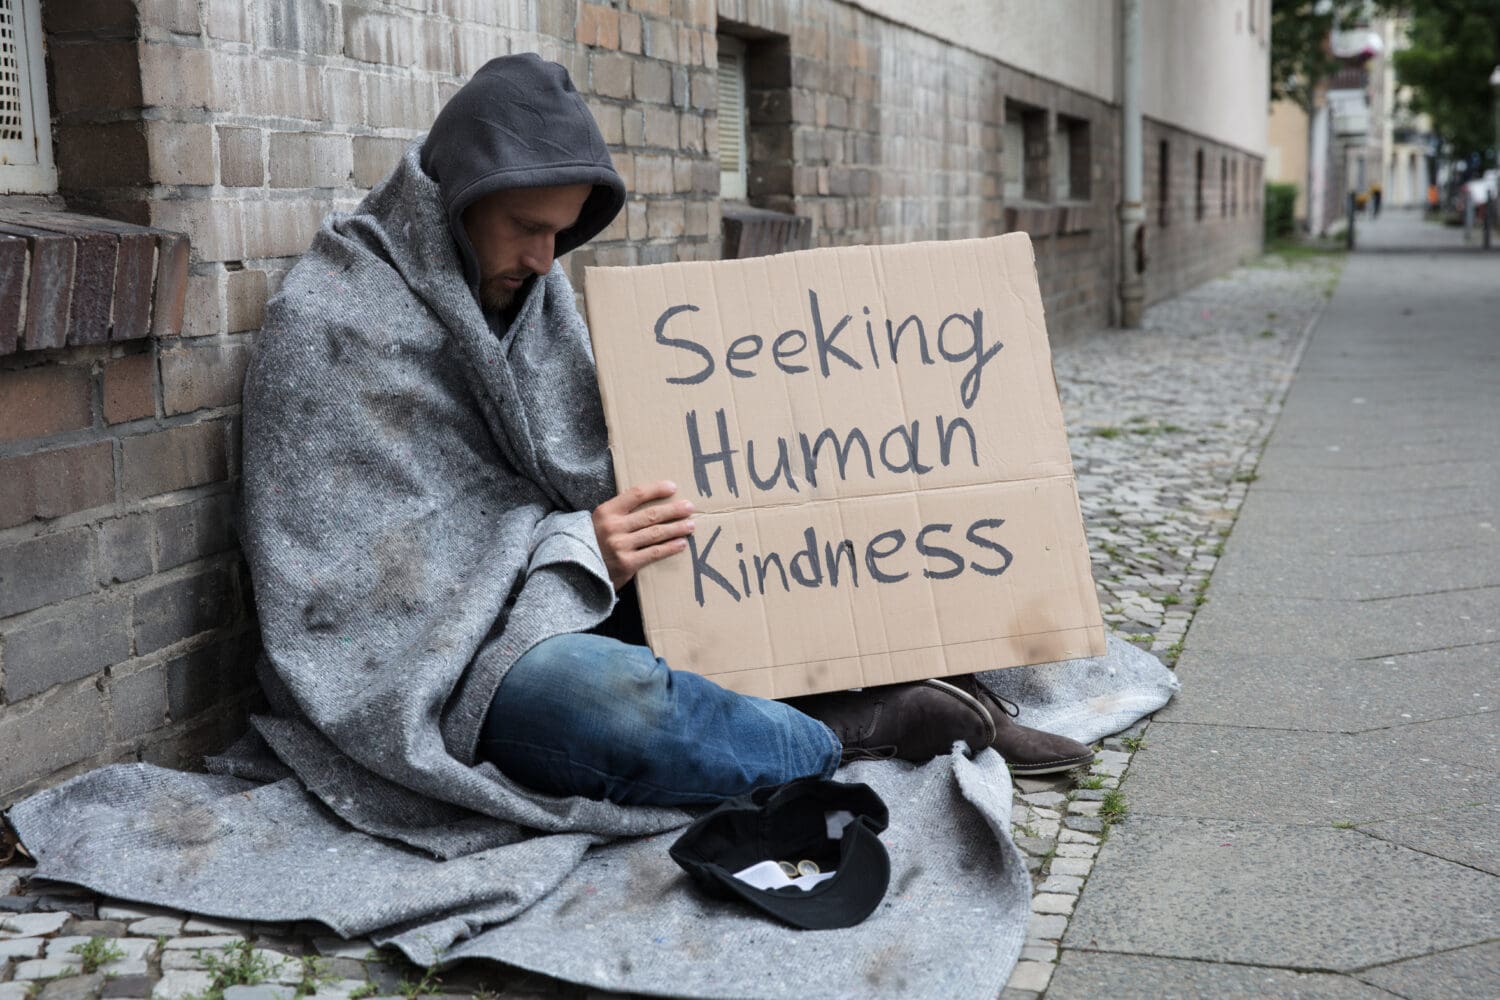
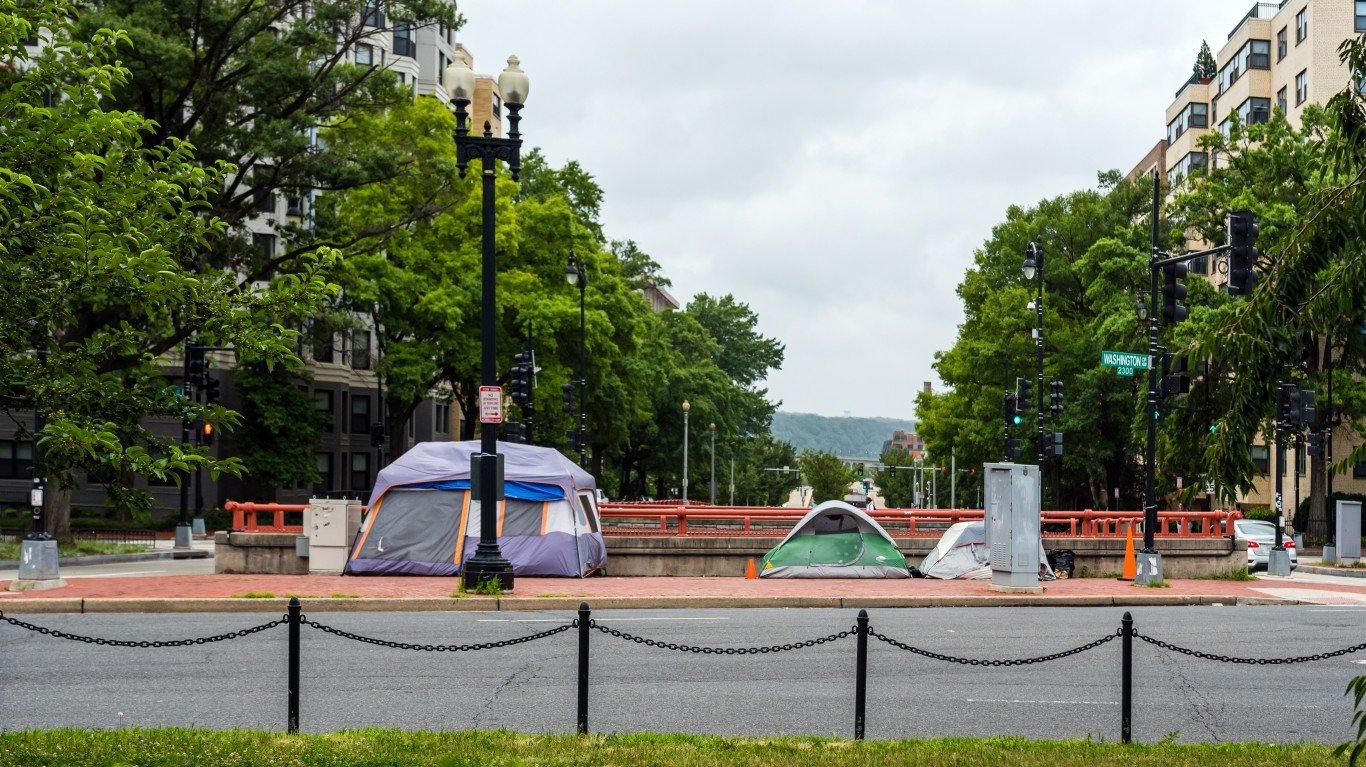
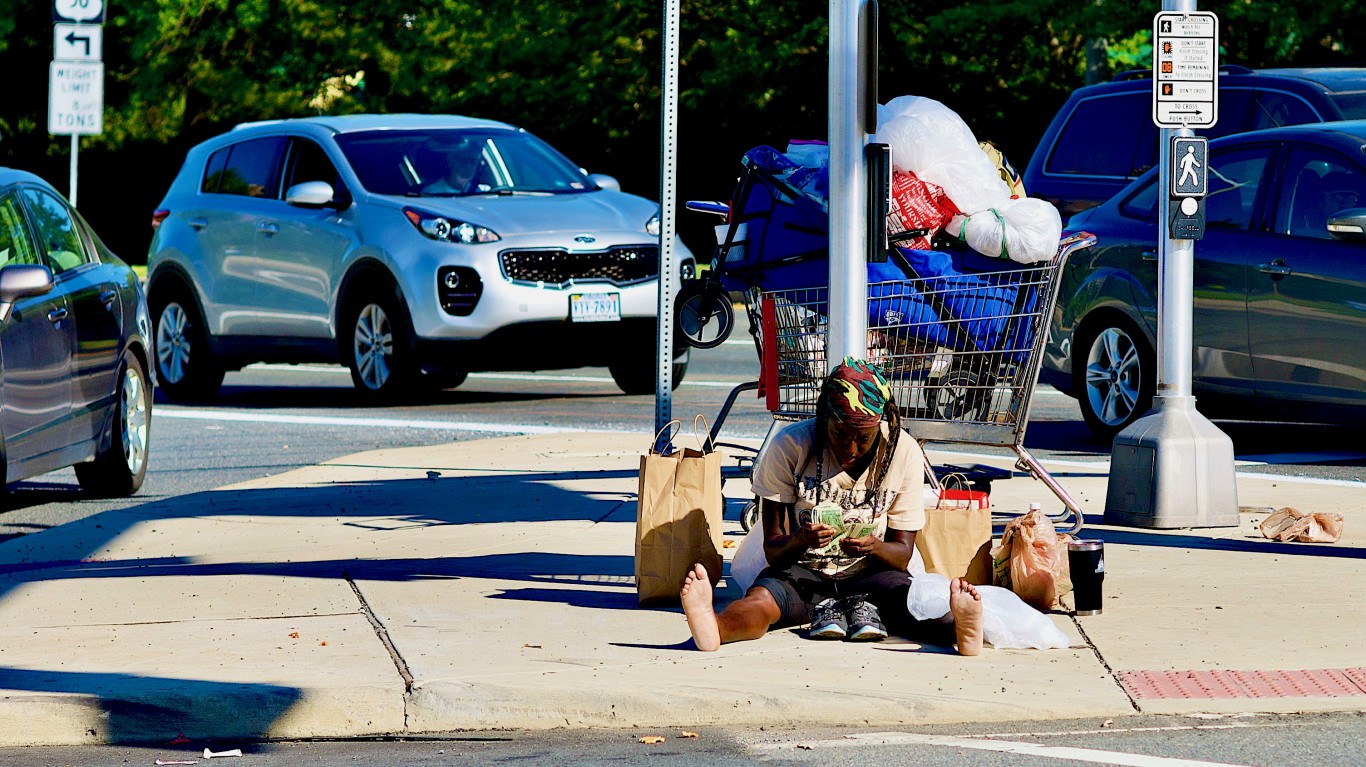
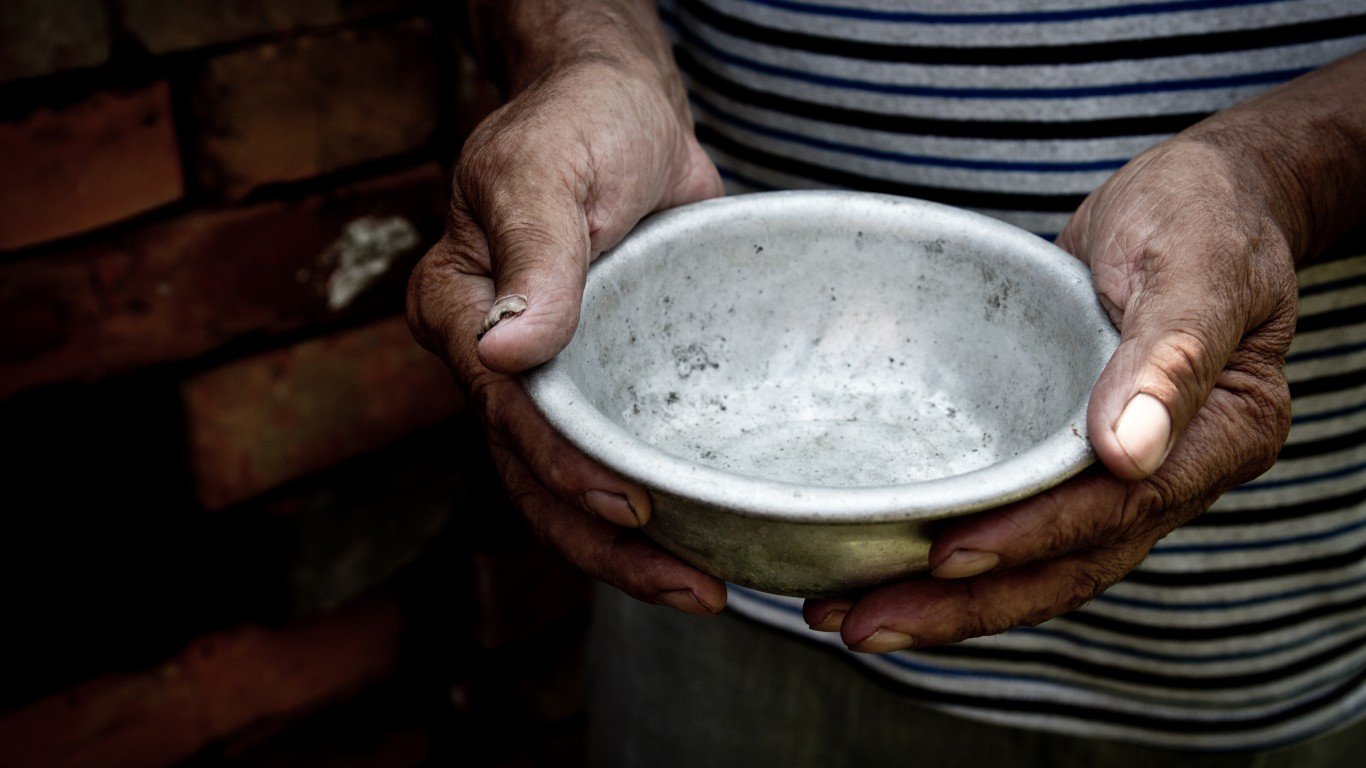
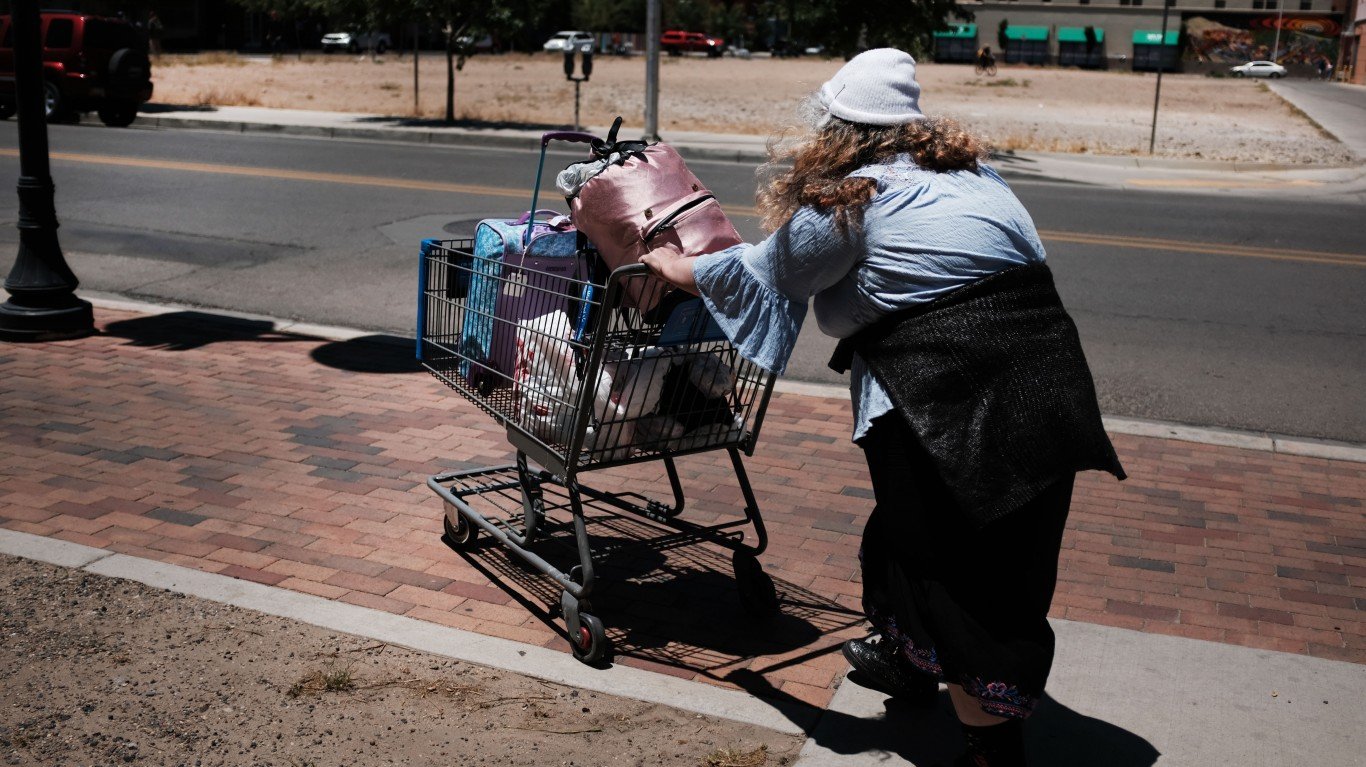
The U.S. Supreme Court is about to weigh in on homelessness in April. Homelessness has reached a record high in 2023 — approximately 653,100 people were experiencing homelessness on a single night in January, a 12% increase from 2022. At the same time, state and local jurisdictions have argued that a lower court decision has prevented them from addressing homeless encampments.
The 2018 decision has barred authorities from enforcing local ordinances that prohibit sleeping and camping in parks and on public property. The 9th U.S. Circuit Court of Appeals ruled it was unconstitutional to punish homelessness. Among the people experiencing homelessness in 2023, 60% were staying in sheltered locations, while 40% were unsheltered. So the question is where is homelessness getting worse.
To find the states where homelessness improved and worsened the most, 24/7 Wall St. reviewed point-in-time homelessness data from the HUD. States and the District of Columbia are ranked by the percent change in homelessness over the five-year period — 2018 to 2023. All homelessness data is from the HUD. State population totals are from the Census Bureau Vintage 2023 and from the 2018 American Community Survey. Median household income data are also from the respective annual ACSs.
Compared to 2018, when 552,830 people were experiencing homelessness nationwide, homelessness increased by 18.1% by 2023. Looking at individual states, homelessness declined in just 12 states as well as in D.C. In the rest, homelessness worsened, growing by more than the national average in 18 states, and by more than 50% in six states. (Also see: Who are the Homeless in Every State.)
While the court ruling affected mostly Western states, the three states where homelessness worsened the most over the five-year period are in the Northeast.
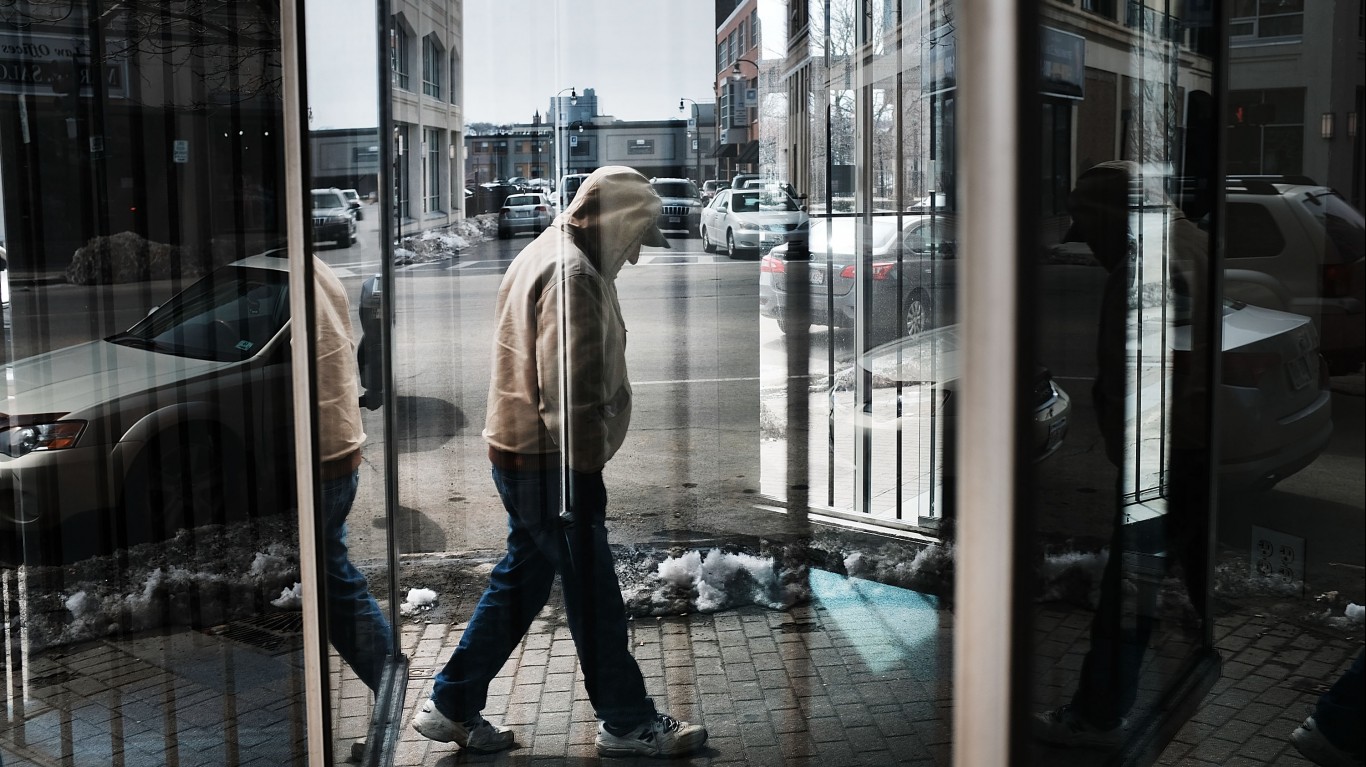
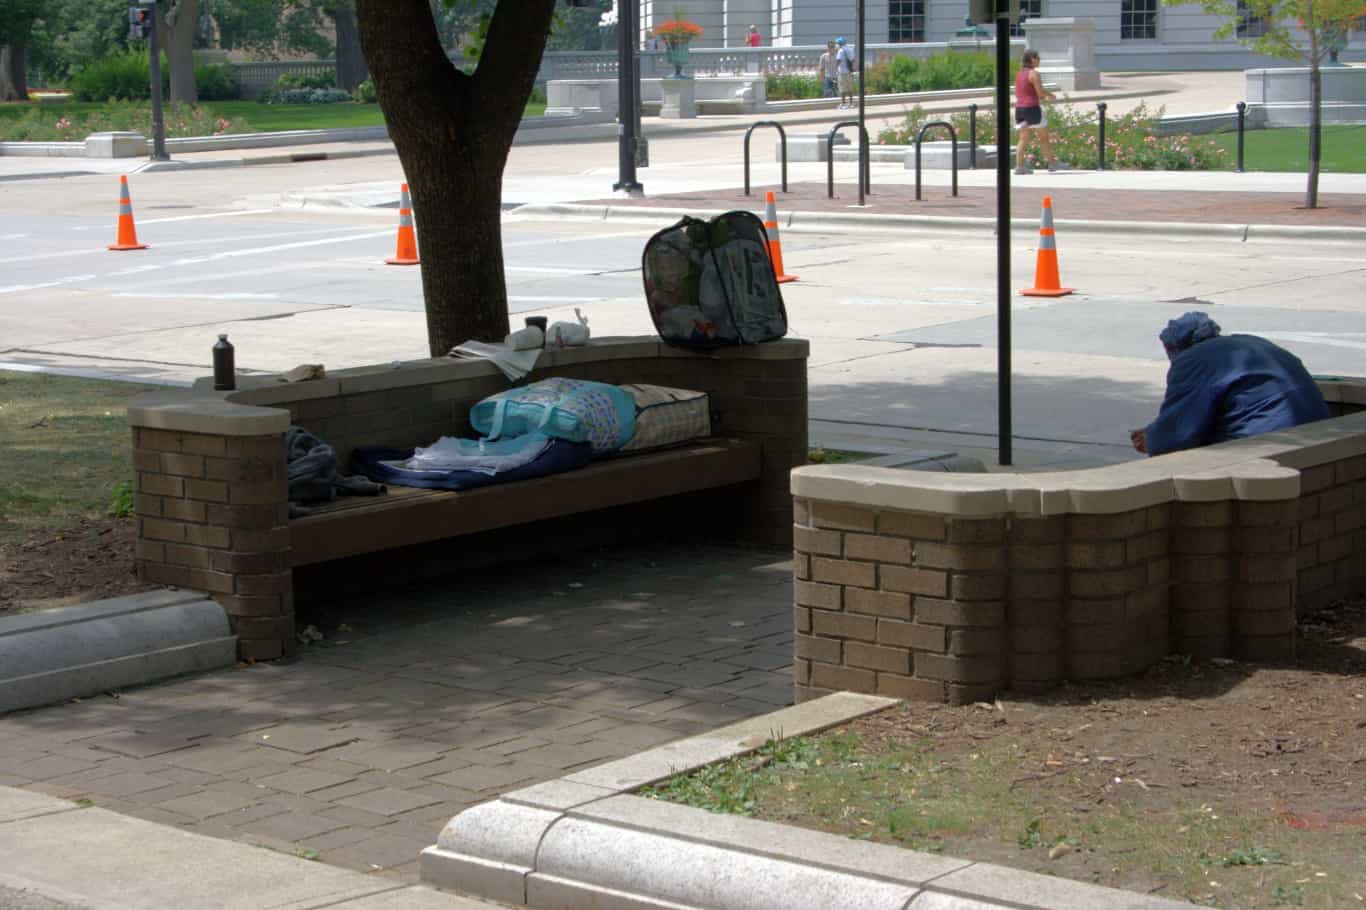
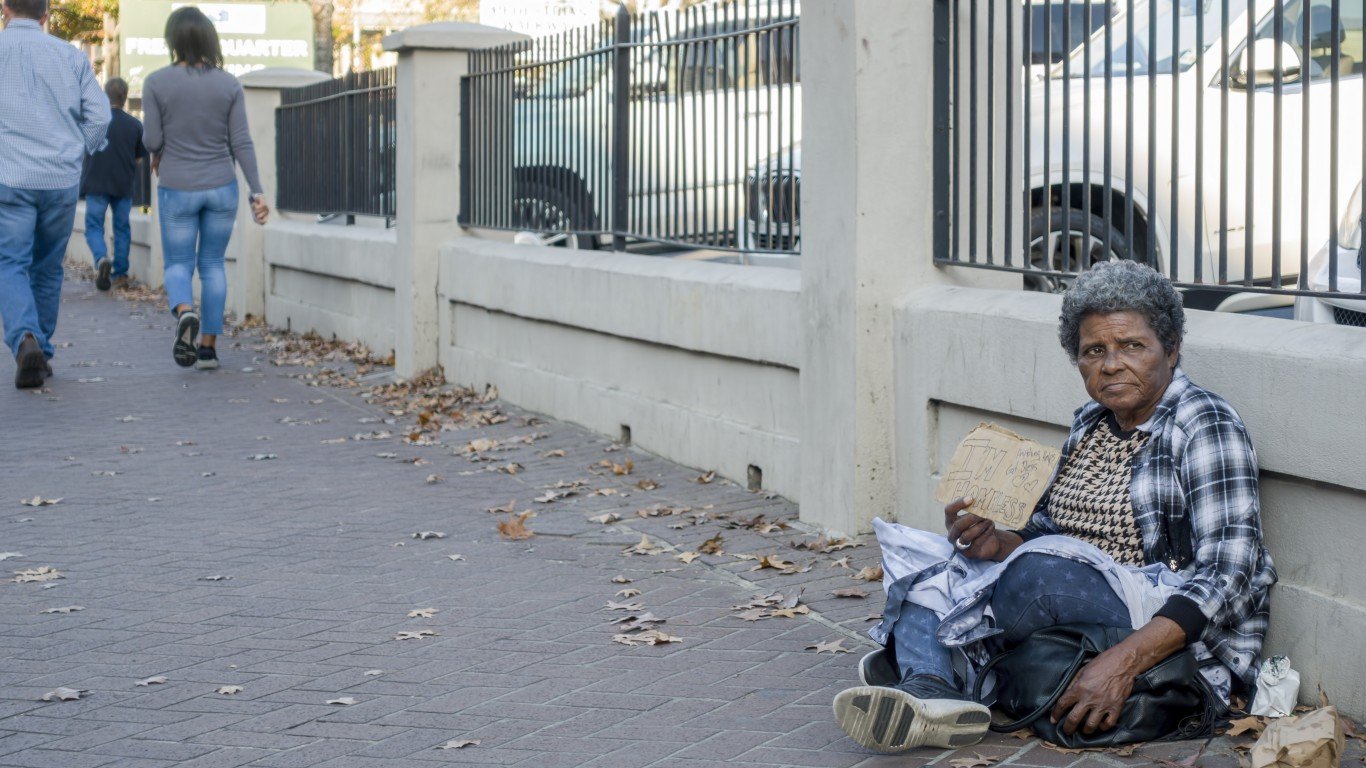
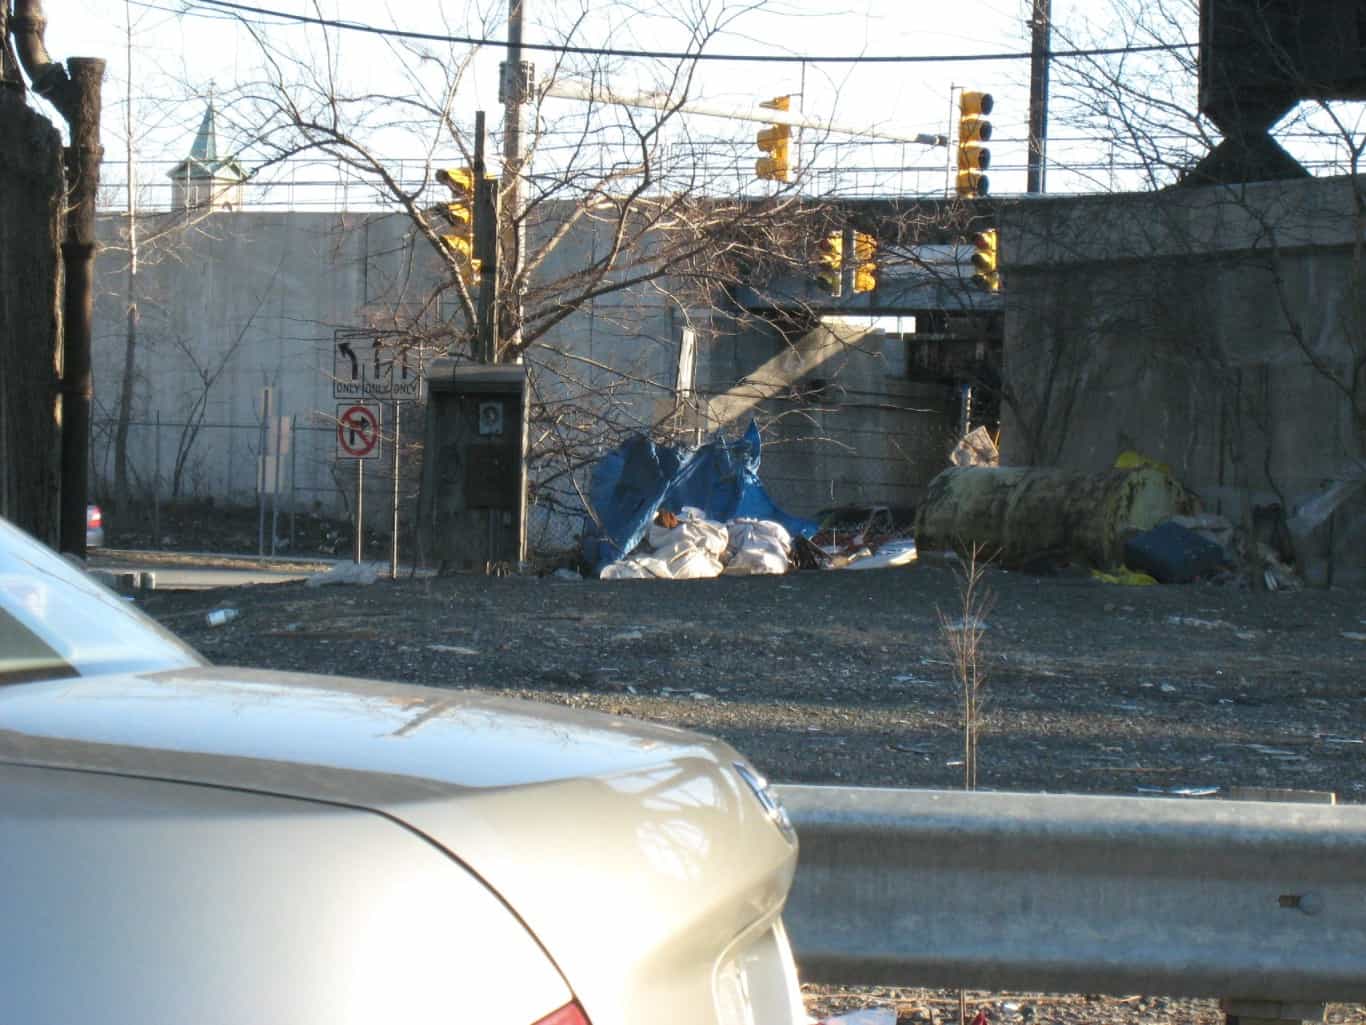
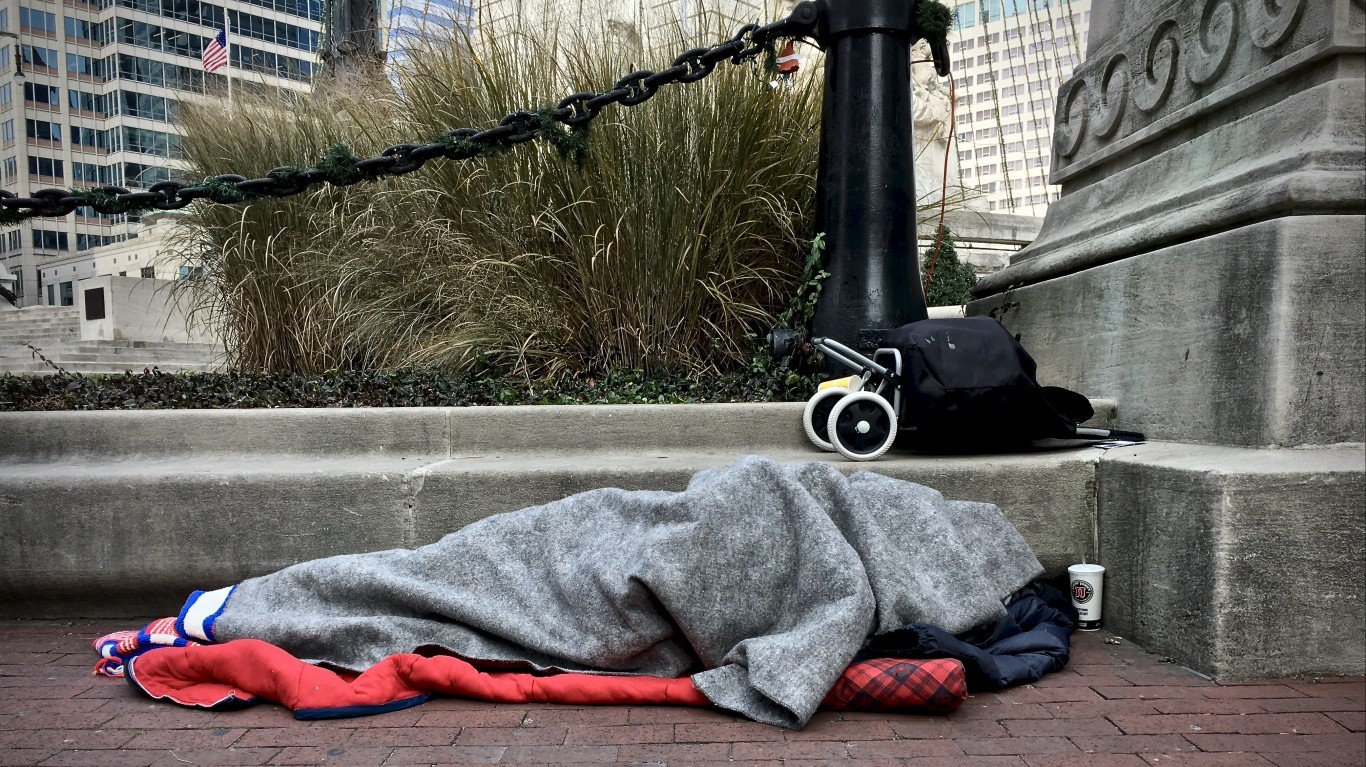
51. District of Columbia
Source: Askolds / iStock Editorial via Getty Images
- Change in homelessness, 2018-2023: -28.7% (-1,982 people in total)
- Total homelessness, 2023: 4,922 — or 72.5 per 10,000 people (the highest)
- Total homelessness, 2018: 6,904 — or 98.3 per 10,000 people (the highest)
- Median household income growth: 22.6% — 25th highest (2017: $82,372; 2022: $101,027)
- Change in state population: -3.3% (2018: 702,455; 2023: 678,972)
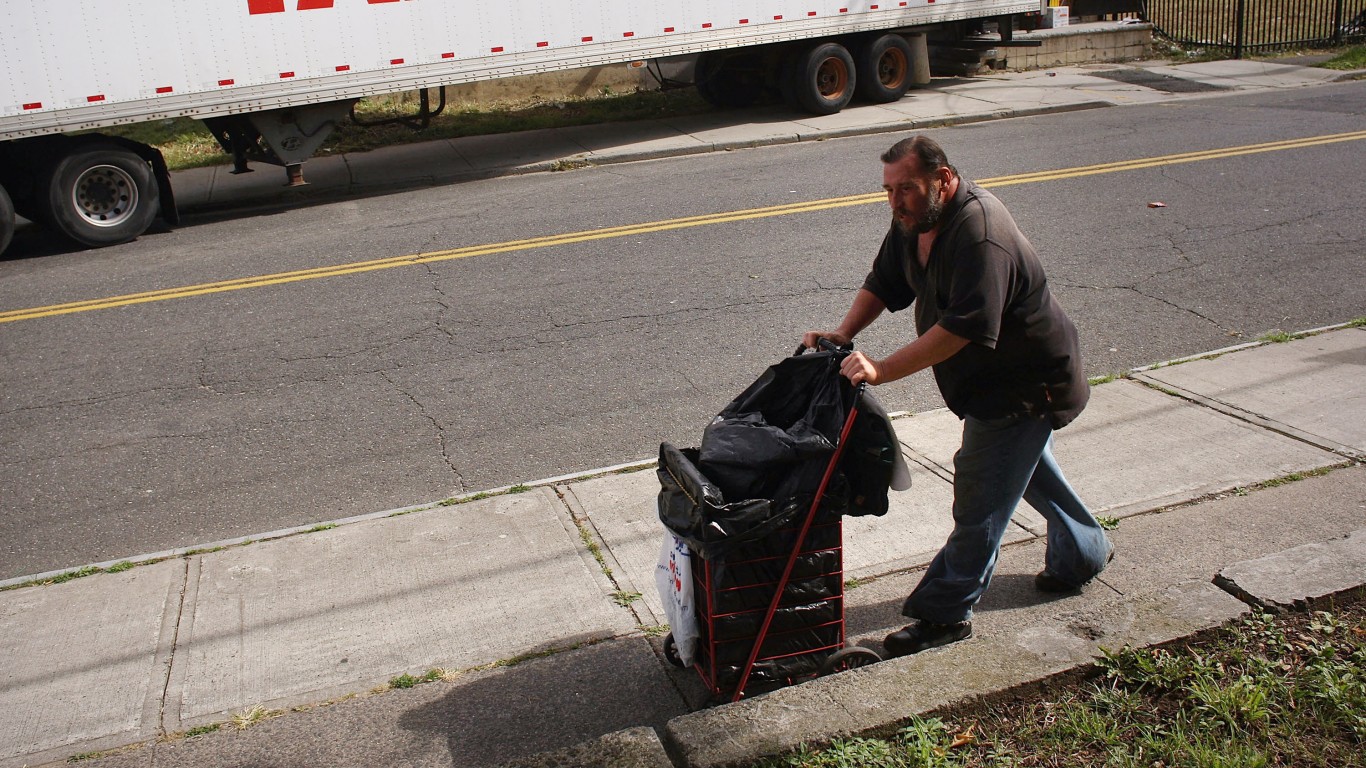
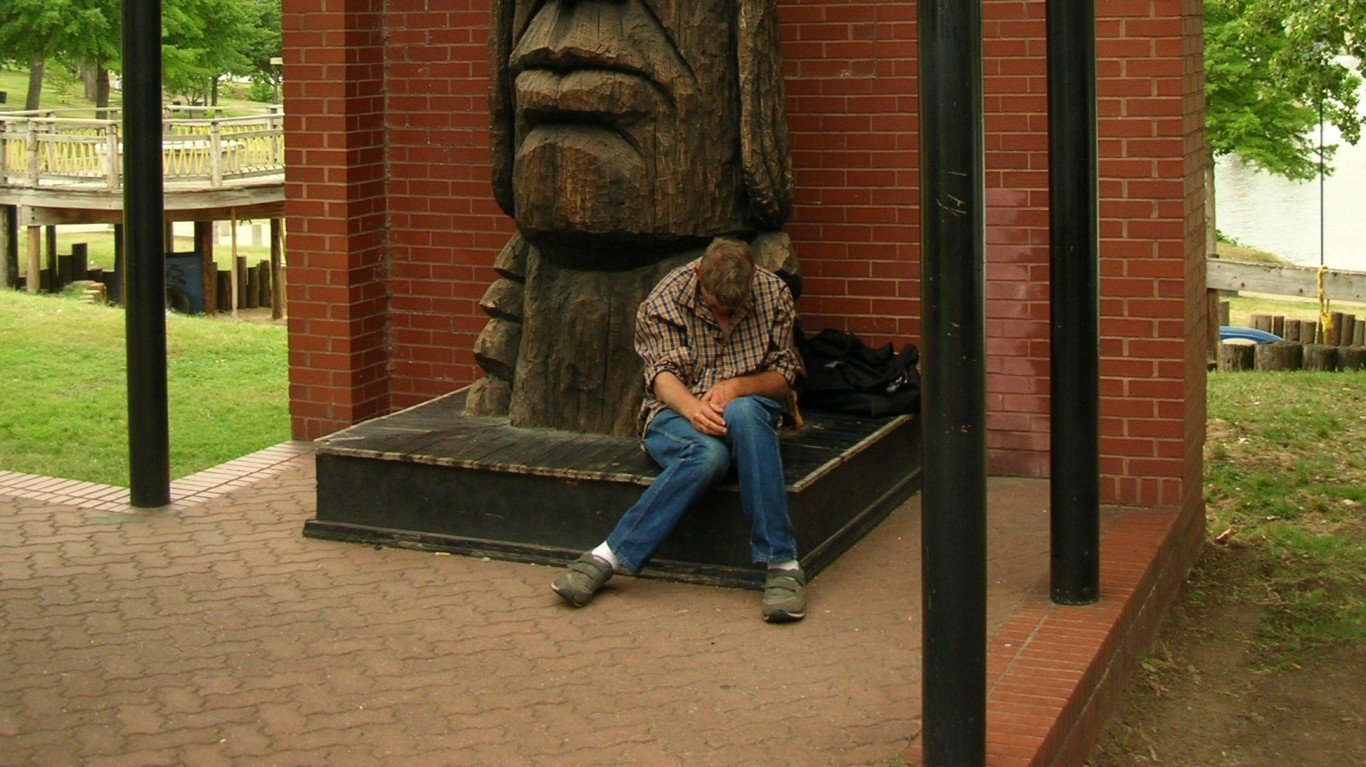
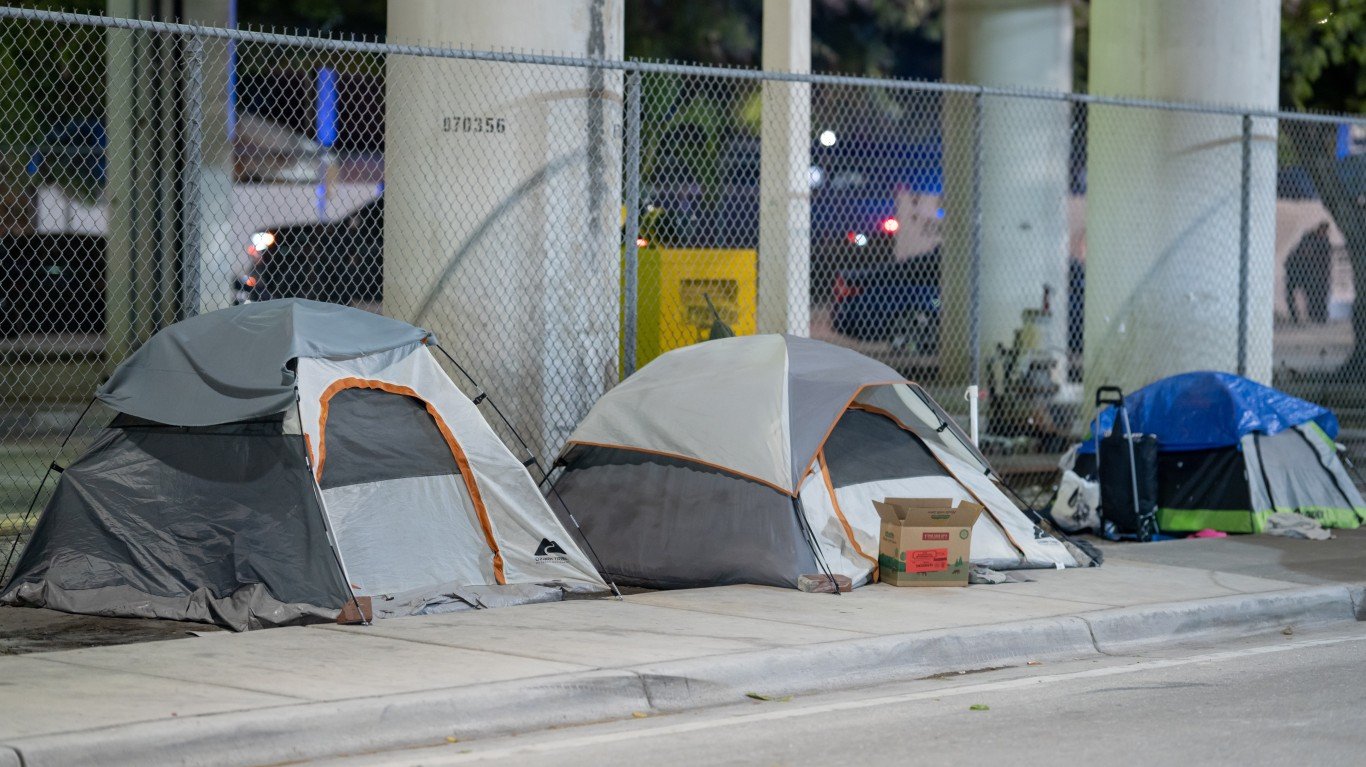
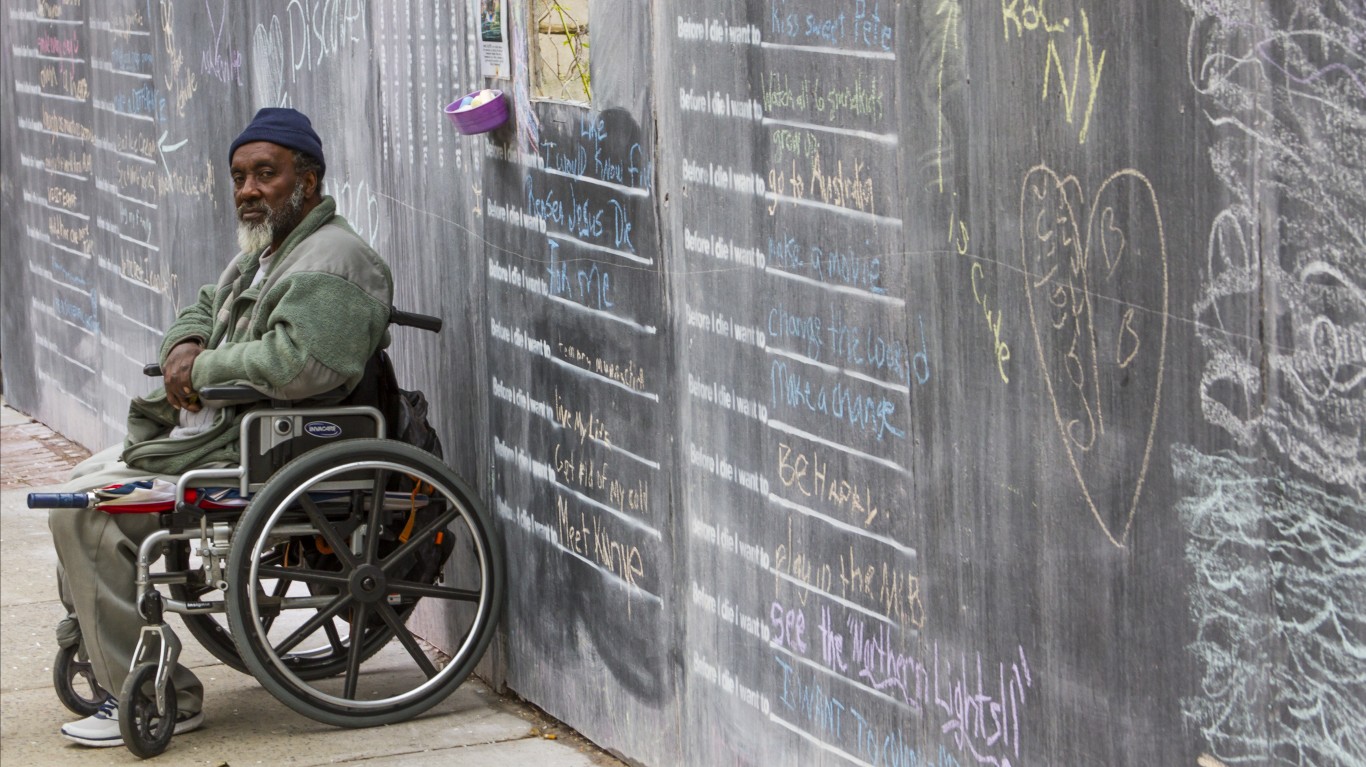
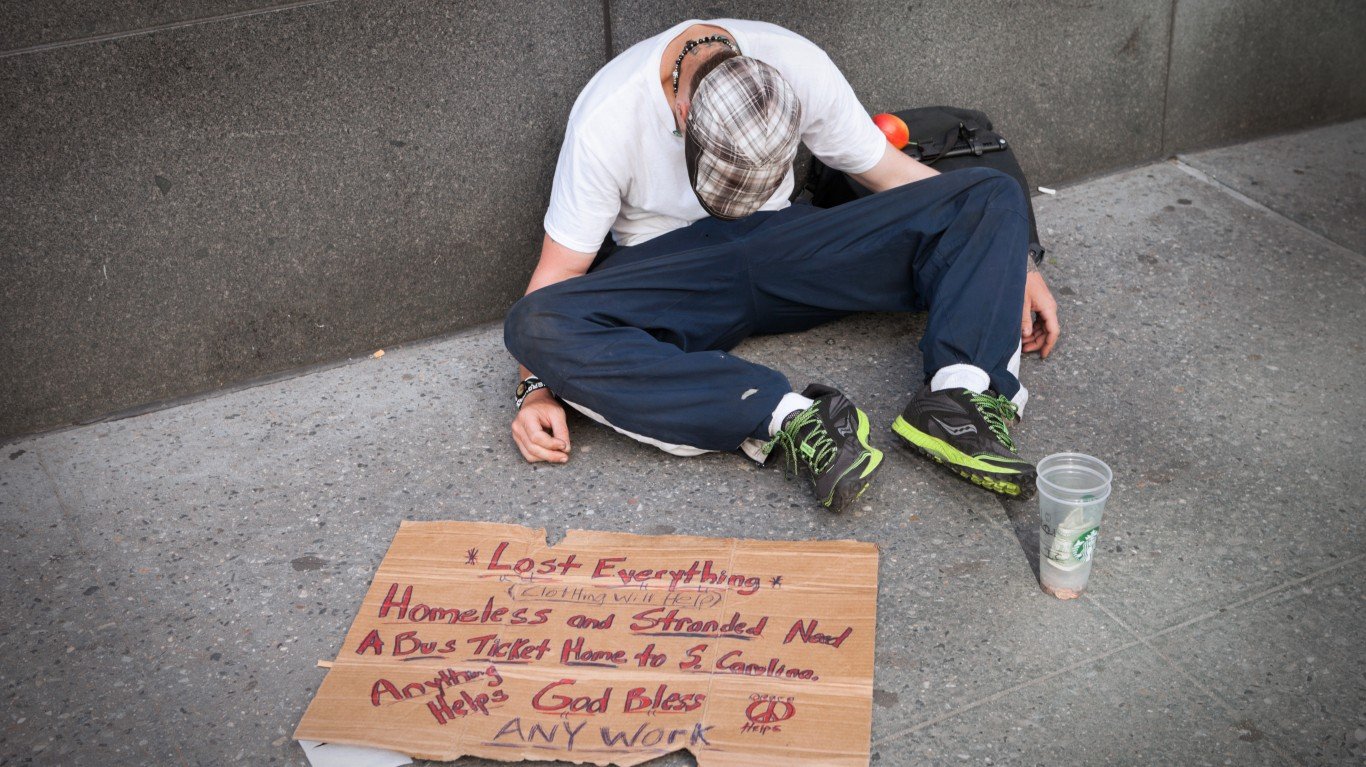
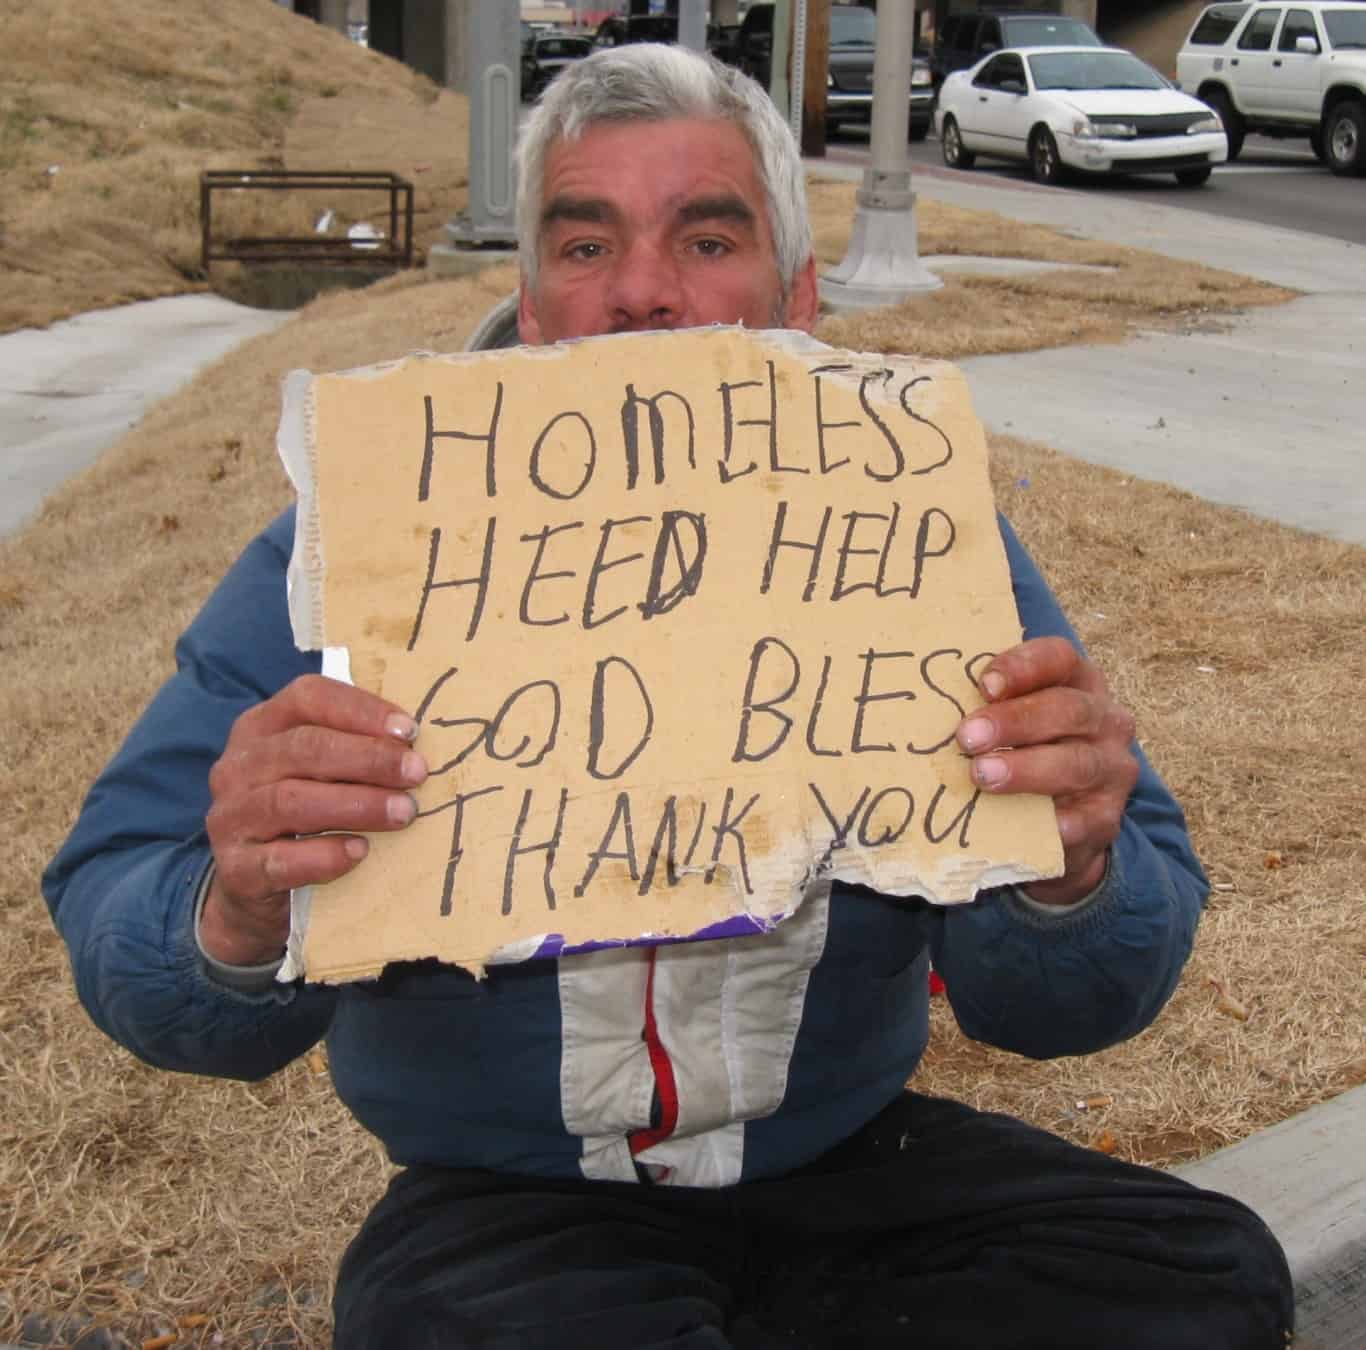
50. Mississippi
Source: Spencer Platt / Getty Images News via Getty Images
- Change in homelessness, 2018-2023: -27.4% (-370 people in total)
- Total homelessness, 2023: 982 — or 3.3 per 10,000 people (the lowest)
- Total homelessness, 2018: 1,352 — or 4.5 per 10,000 people (the lowest)
- Median household income growth: 21.1% — 17th lowest (2017: $43,529; 2022: $52,719)
- Change in state population: -1.6% (2018: 2,986,530; 2023: 2,939,690)
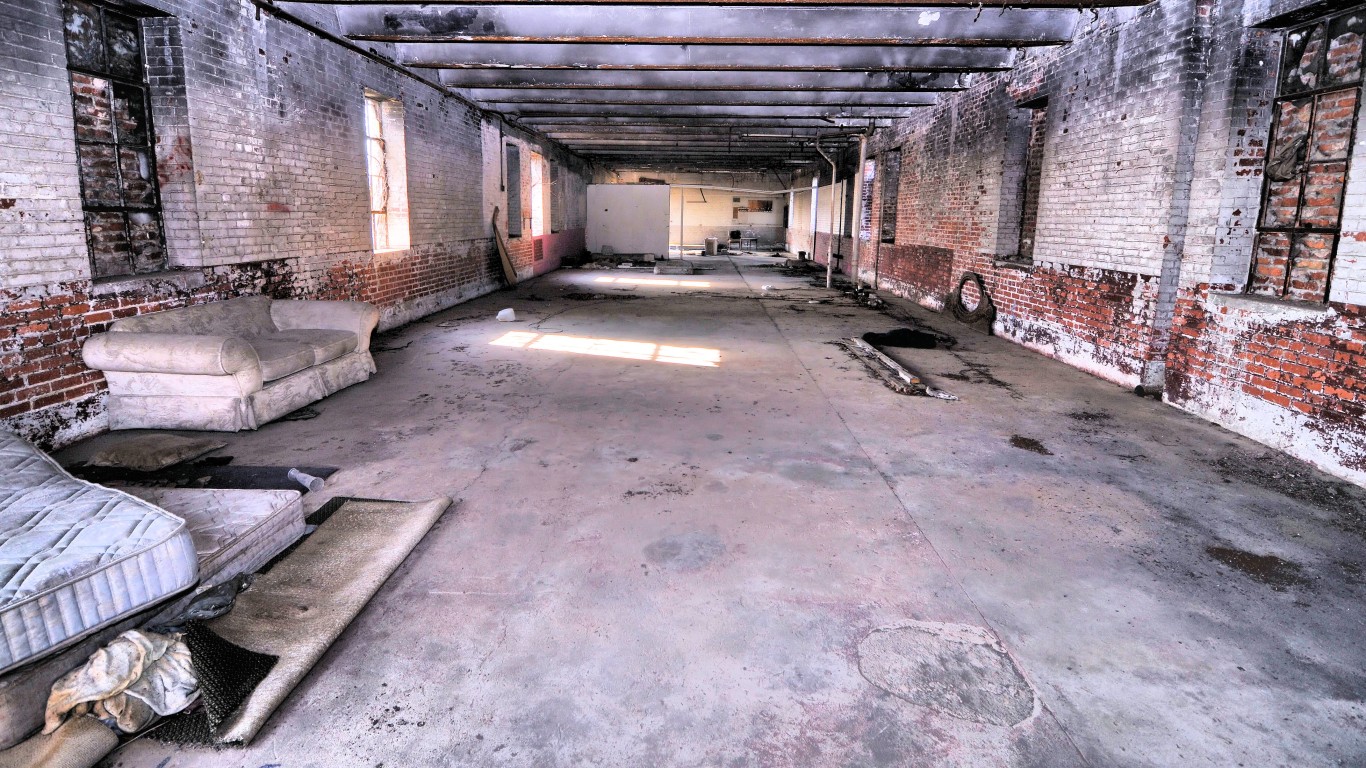
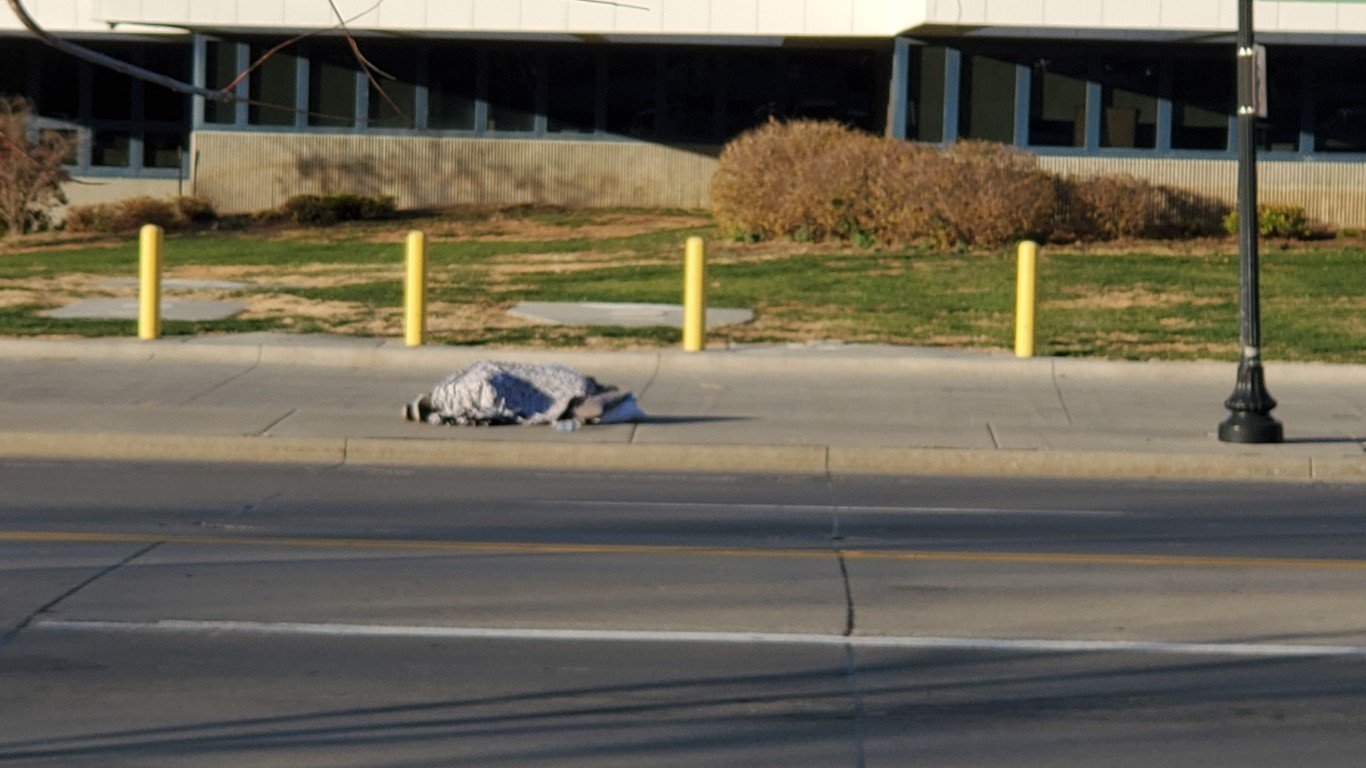
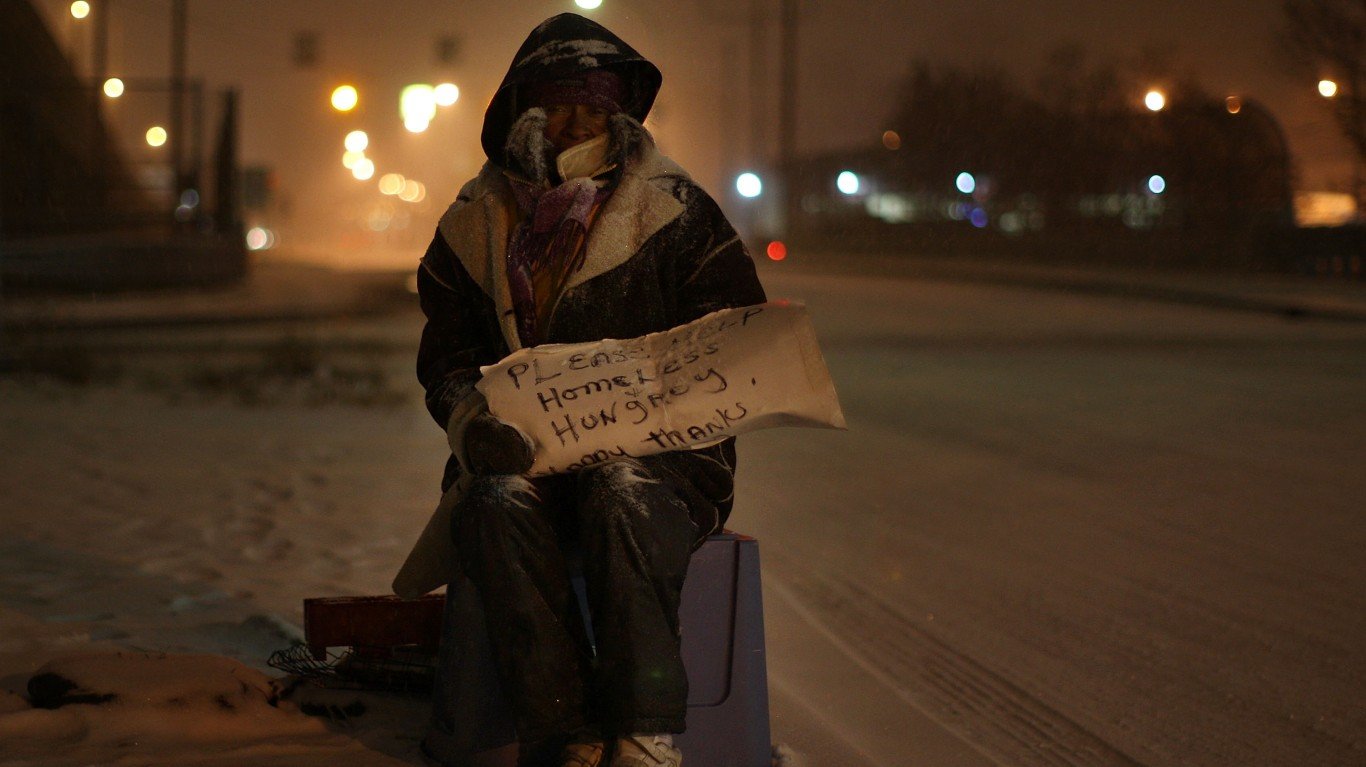
49. Connecticut
Source: Spencer Platt / Getty Images News via Getty Images
- Change in homelessness, 2018-2023: -24.2% (-961 people in total)
- Total homelessness, 2023: 3,015 — or 8.3 per 10,000 people (9th lowest)
- Total homelessness, 2018: 3,976 — or 11.1 per 10,000 people (24th highest)
- Median household income growth: 19.2% — 8th lowest (2017: $74,168; 2022: $88,429)
- Change in state population: +1.2% (2018: 3,572,665; 2023: 3,617,176)
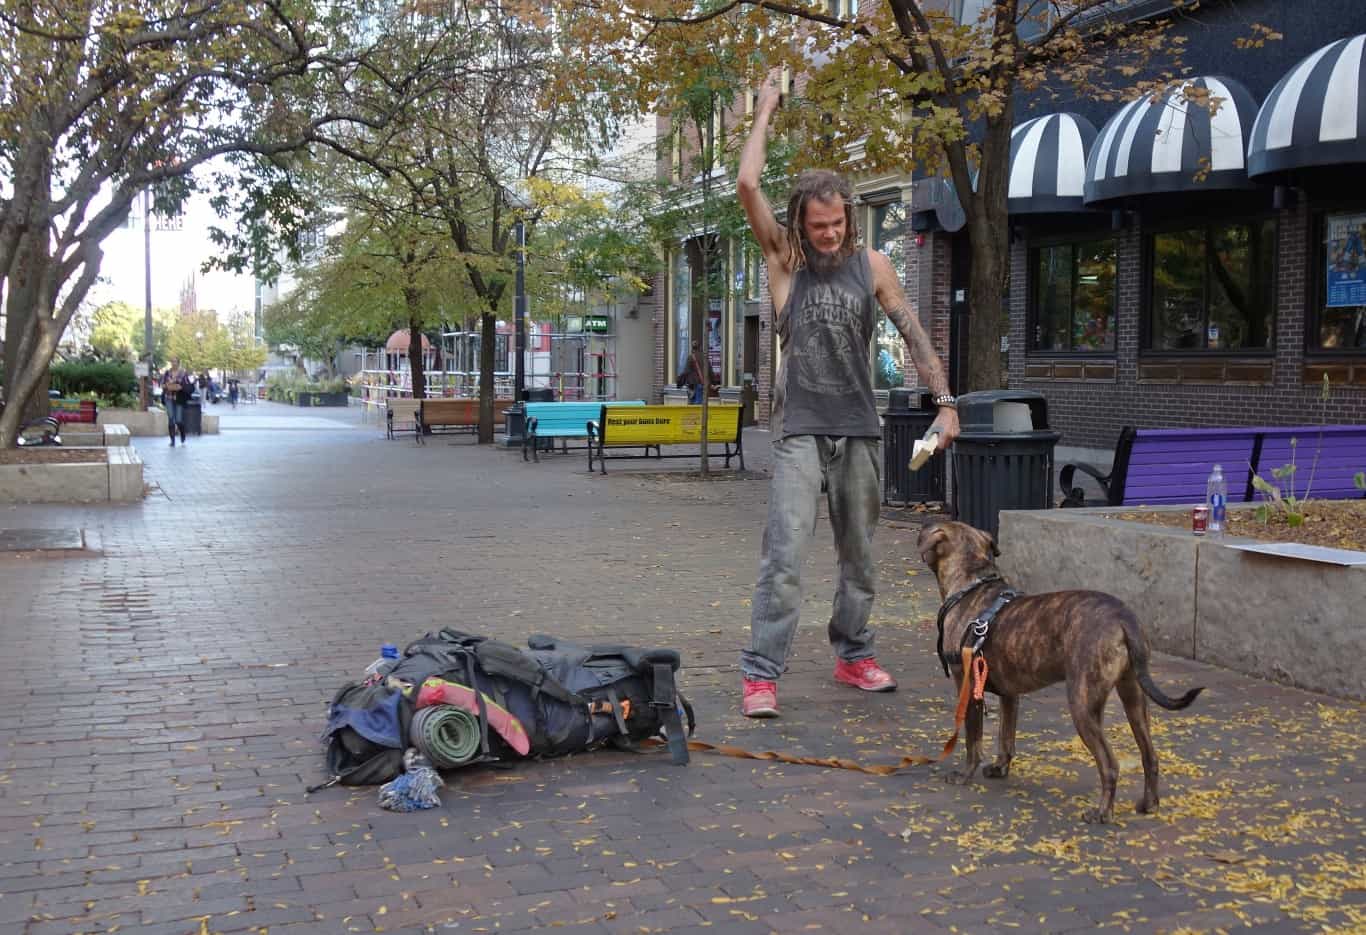
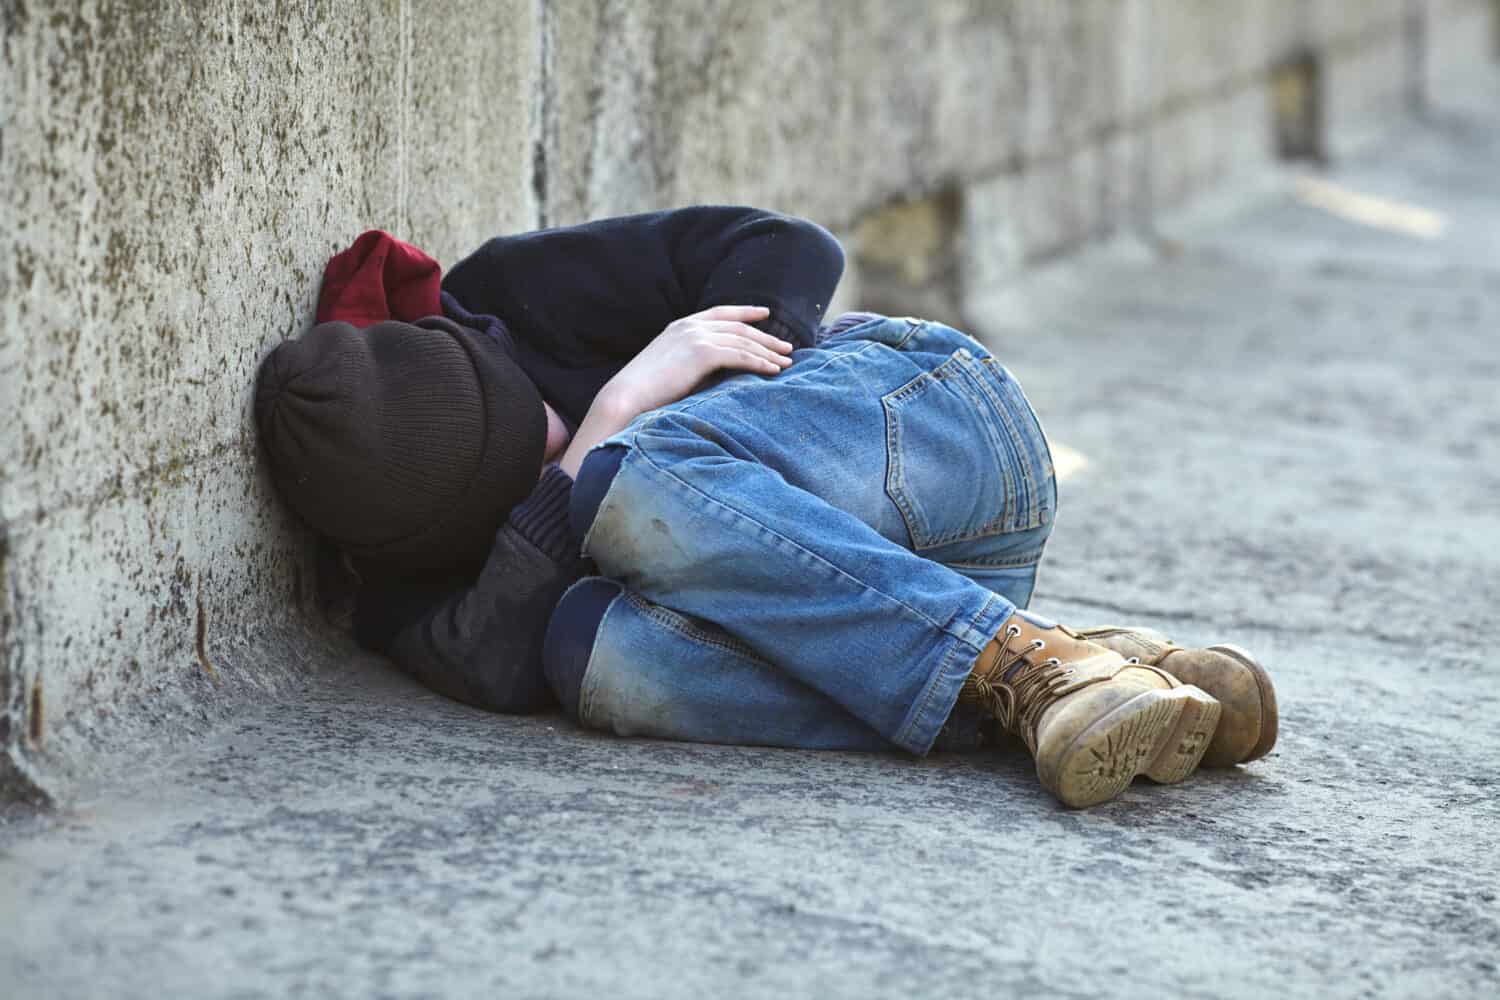
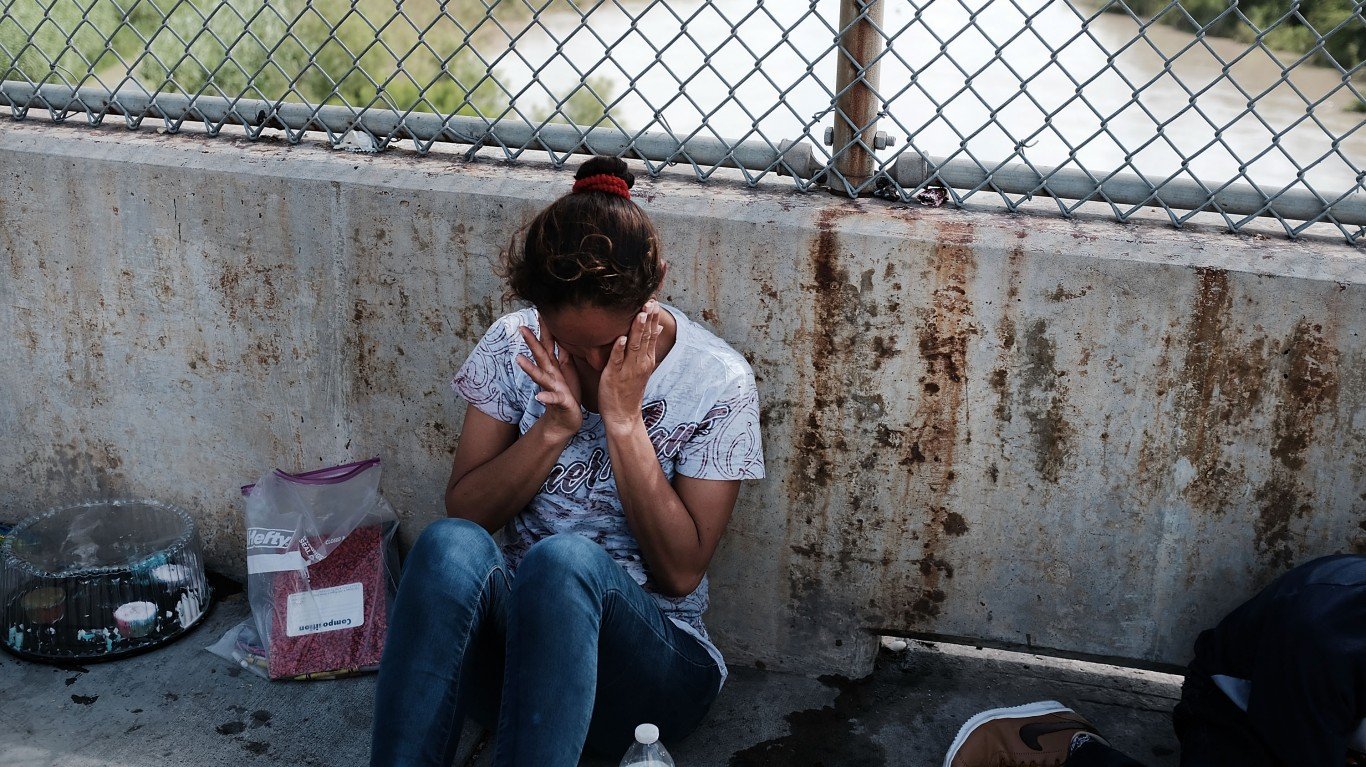
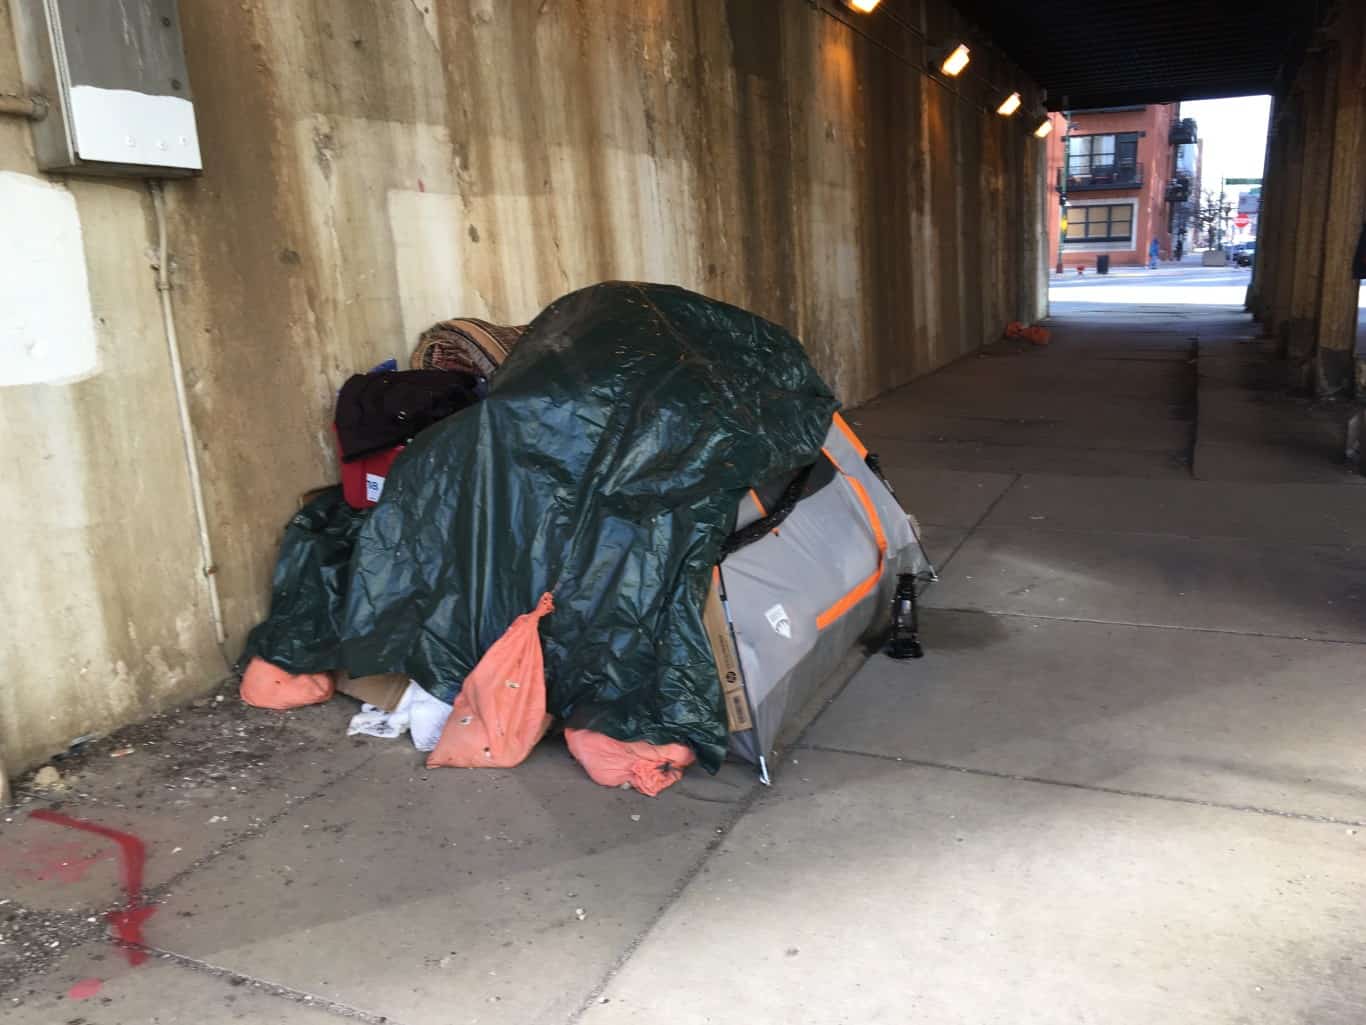
48. Maryland
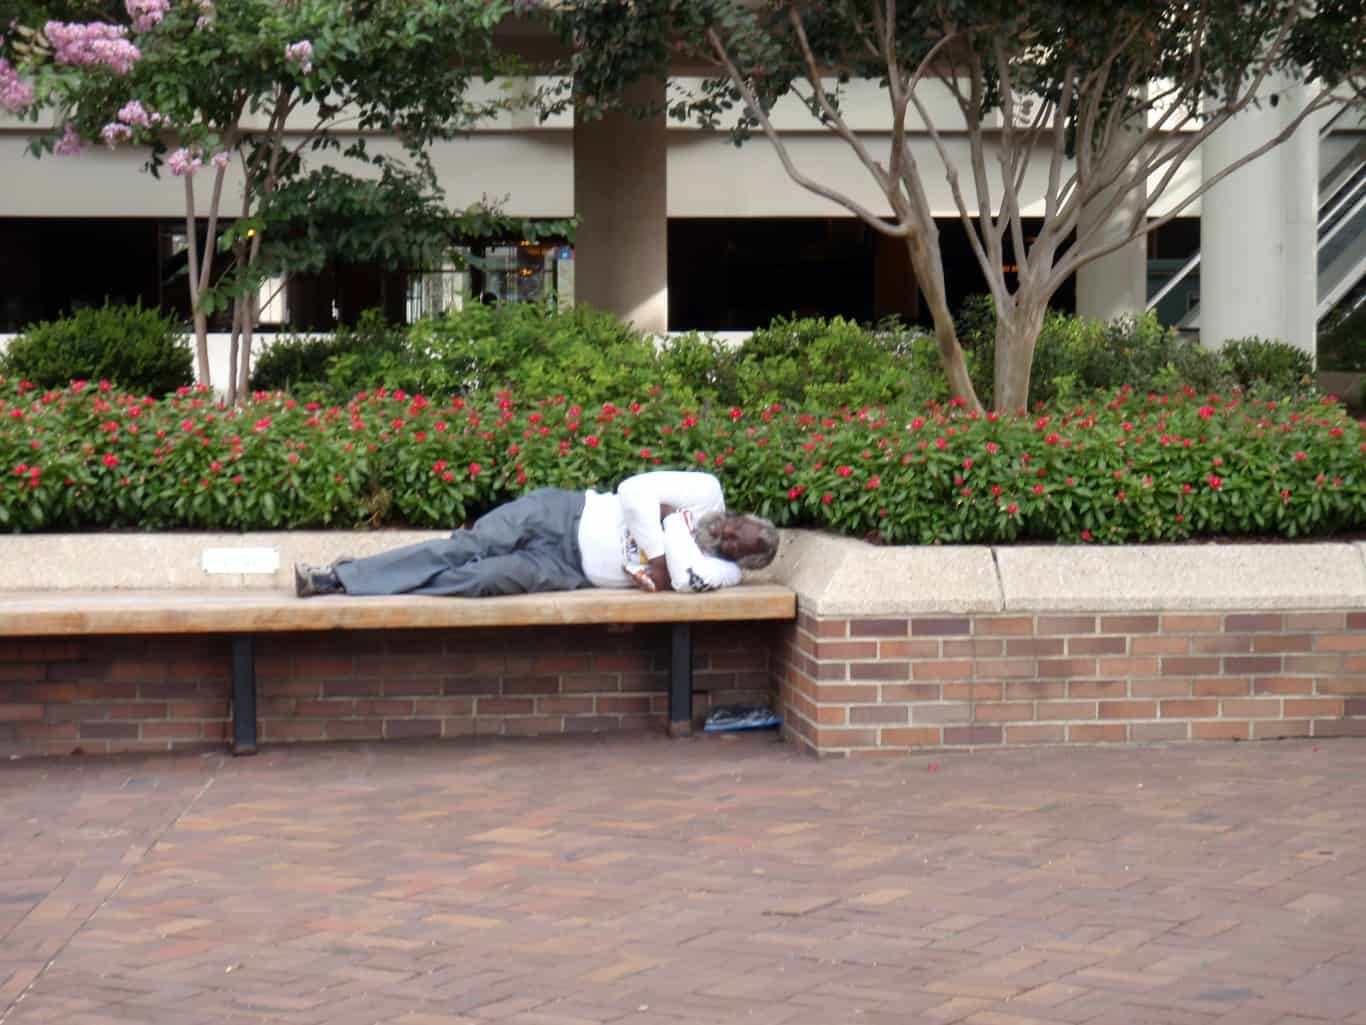
Source: daquellamanera / Flickr
- Change in homelessness, 2018-2023: -17.9% (-1,279 people in total)
- Total homelessness, 2023: 5,865 — or 9.5 per 10,000 people (17th lowest)
- Total homelessness, 2018: 7,144 — or 11.8 per 10,000 people (20th highest)
- Median household income growth: 17.6% — 4th lowest (2017: $80,776; 2022: $94,991)
- Change in state population: +2.3% (2018: 6,042,718; 2023: 6,180,253)
47. Wyoming

Source: addkm / Shutterstock.com
- Change in homelessness, 2018-2023: -16.7% (-107 people in total)
- Total homelessness, 2023: 532 — or 9.1 per 10,000 people (16th lowest)
- Total homelessness, 2018: 639 — or 11.1 per 10,000 people (25th highest)
- Median household income growth: 15.9% — the lowest (2017: $60,434; 2022: $70,042)
- Change in state population: +1.1% (2018: 577,737; 2023: 584,057)
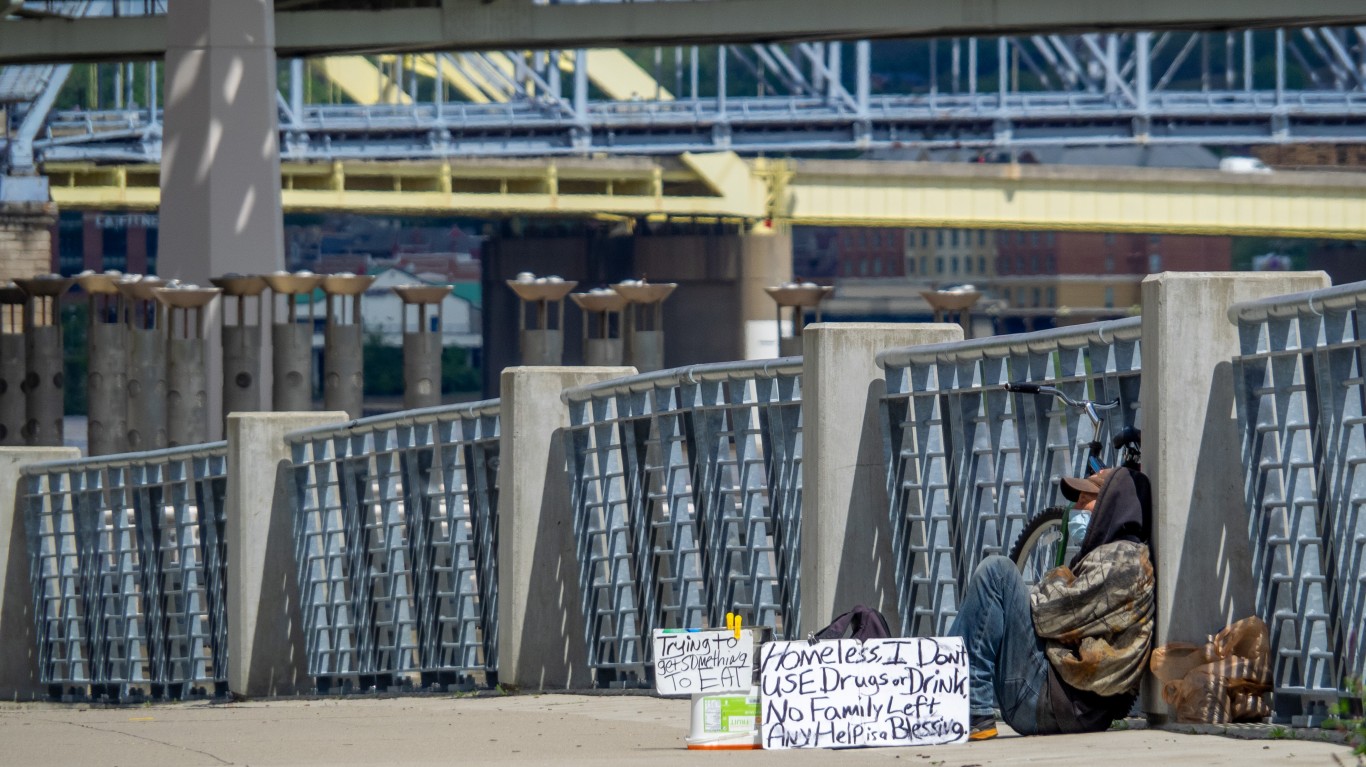
46. Pennsylvania
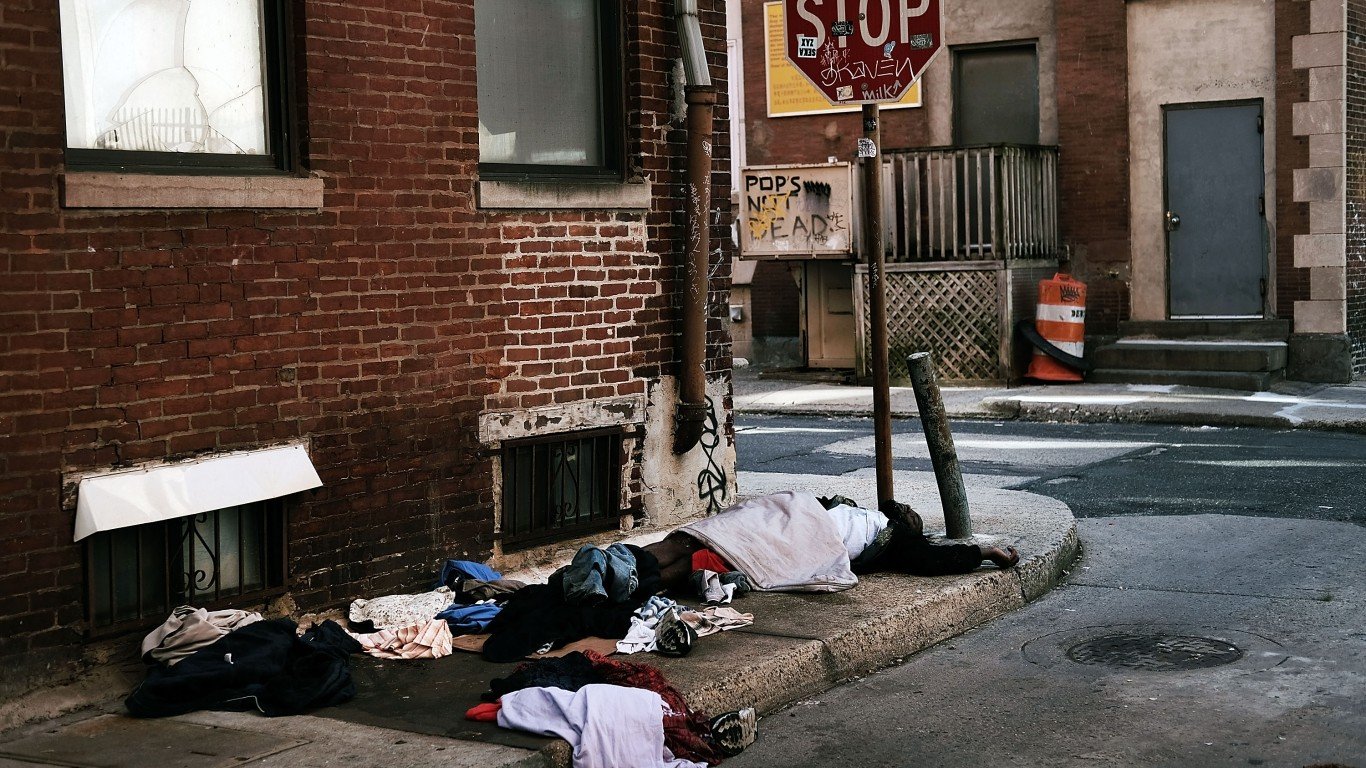
Source: Spencer Platt / Getty Images News via Getty Images
- Change in homelessness, 2018-2023: -7.1% — (-956 people in total)
- Total homelessness, 2023: 12,556 — or 9.7 per 10,000 people (20th lowest)
- Total homelessness, 2018: 13,512 — or 10.6 per 10,000 people (25th lowest)
- Median household income growth: 21.3% — 18th lowest (2017: $59,195; 2022: $71,798)
- Change in state population: +1.2% (2018: 12,807,060; 2023: 12,961,683)
45. Hawaii
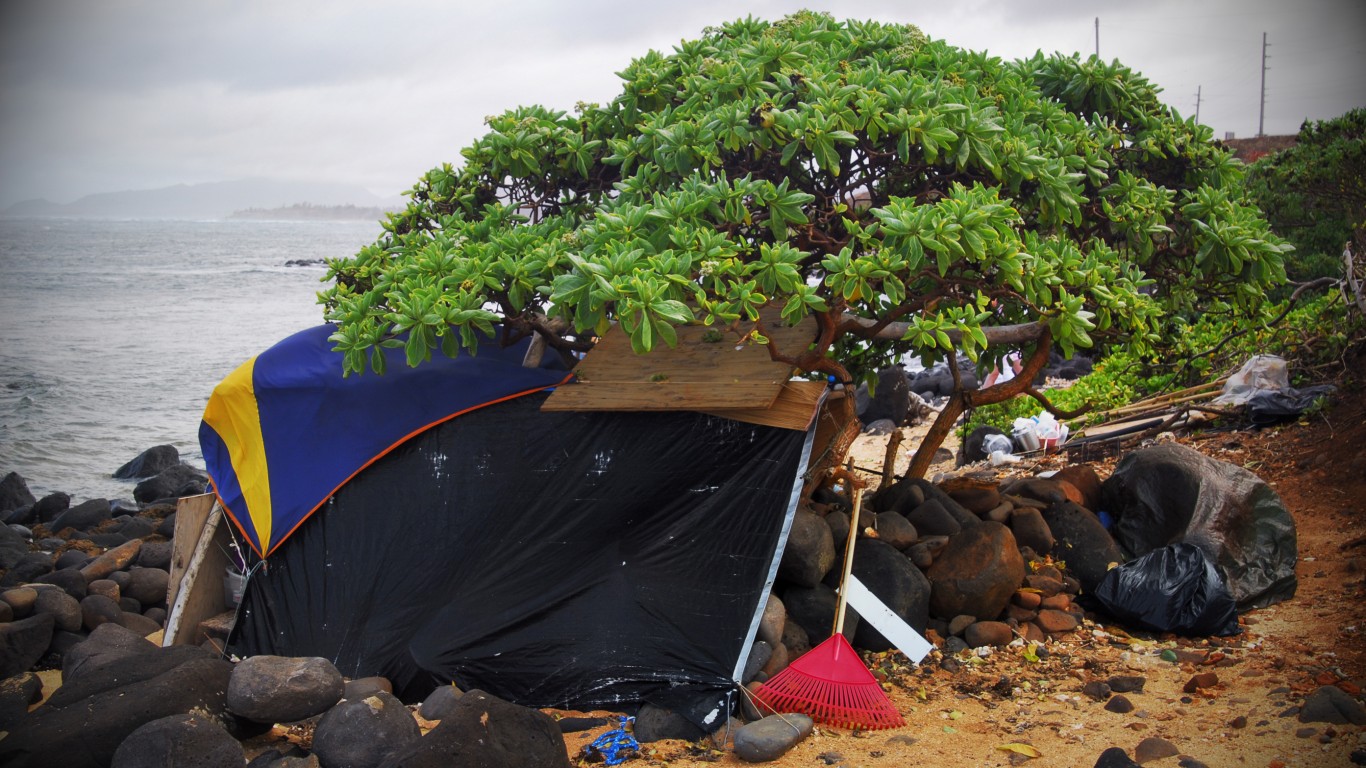
Source: nojustice / iStock via Getty Images
- Change in homelessness, 2018-2023: -4.7% (-307 people in total)
- Total homelessness, 2023: 6,223 — or 43.4 per 10,000 people (6th highest)
- Total homelessness, 2018: 6,530 — or 46.0 per 10,000 people (3rd highest)
- Median household income growth: 18.9% — 6th lowest (2017: $77,765; 2022: $92,458)
- Change in state population: +1.0% (2018: 1,420,491; 2023: 1,435,138)
44. Massachusetts
Source: Spencer Platt / Getty Images News via Getty Images
- Change in homelessness, 2018-2023: -4.6% — (-927 people in total)
- Total homelessness, 2023: 19,141 — or 27.3 per 10,000 people (10th highest)
- Total homelessness, 2018: 20,068 — or 29.1 per 10,000 people (7th highest)
- Median household income growth: 22.1% — 23rd lowest (2017: $77,385; 2022: $94,488)
- Change in state population: +1.4% (2018: 6,902,149; 2023: 7,001,399)
43. Arkansas
Source: eschipul / Flickr
- Change in homelessness, 2018-2023: -3.8% (-103 people in total)
- Total homelessness, 2023: 2,609 — or 8.5 per 10,000 people (10th lowest)
- Total homelessness, 2018: 2,712 — or 9.0 per 10,000 people (18th lowest)
- Median household income growth: 20.8% — 15th lowest (2017: $45,869; 2022: $55,432)
- Change in state population: +1.8% (2018: 3,013,825; 2023: 3,067,732)
42. Alabama
Source: Shackleford-Photography / iStock via Getty Images
- Change in homelessness, 2018-2023: -3.8% (-130 people in total)
- Total homelessness, 2023: 3,304 — or 6.5 per 10,000 people (2nd lowest)
- Total homelessness, 2018: 3,434 — or 7.0 per 10,000 people (5th lowest)
- Median household income growth: 24.0% — 20th highest (2017: $48,123; 2022: $59,674)
- Change in state population: +4.5% (2018: 4,887,871; 2023: 5,108,468)
41. Iowa
Source: alan-light / Flickr
- Change in homelessness, 2018-2023: -3.5% (-96 people in total)
- Total homelessness, 2023: 2,653 — or 8.3 per 10,000 people (8th lowest)
- Total homelessness, 2018: 2,749 — or 8.7 per 10,000 people (14th lowest)
- Median household income growth: 18.8% — 5th lowest (2017: $58,570; 2022: $69,588)
- Change in state population: +1.6% (2018: 3,156,145; 2023: 3,207,004)
40. Wisconsin
Source: midnightcomm / Flickr
- Change in homelessness, 2018-2023: -0.9% (-46 people in total)
- Total homelessness, 2023: 4,861 — or 8.2 per 10,000 people (7th lowest)
- Total homelessness, 2018: 4,907 — or 8.4 per 10,000 people (13th lowest)
- Median household income growth: 19.7% — 9th lowest (2017: $59,305; 2022: $70,996)
- Change in state population: +1.7% (2018: 5,813,568; 2023: 5,910,955)
39. Florida
Source: felixmizioznikov / iStock Editorial via Getty Images
- Change in homelessness, 2018-2023: -0.9% (-274 people in total)
- Total homelessness, 2023: 30,756 — or 13.6 per 10,000 people (20th highest)
- Total homelessness, 2018: 31,030 — or 14.6 per 10,000 people (13th highest)
- Median household income growth: 31.8% — 3rd highest (2017: $52,594; 2022: $69,303)
- Change in state population: +6.2% (2018: 21,299,325; 2023: 22,610,726)
38. Nebraska
Source: Wanda Jewell / iStock via Getty Images
- Change in homelessness, 2018-2023: +1.7% (+41 people in total)
- Total homelessness, 2023: 2,462 — or 12.4 per 10,000 people (22nd highest)
- Total homelessness, 2018: 2,421 — or 12.5 per 10,000 people (18th highest)
- Median household income growth: 16.1% — 2nd lowest (2017: $59,970; 2022: $69,597)
- Change in state population: +2.5% (2018: 1,929,268; 2023: 1,978,379)
37. South Carolina
Source: Roman Bodnarchuk / Shutterstock.com
- Change in homelessness, 2018-2023: +3.1% (+120 people in total)
- Total homelessness, 2023: 4,053 — or 7.5 per 10,000 people (4th lowest)
- Total homelessness, 2018: 3,933 — or 7.7 per 10,000 people (8th lowest)
- Median household income growth: 26.8% — 15th highest (2017: $50,570; 2022: $64,115)
- Change in state population: +5.7% (2018: 5,084,127; 2023: 5,373,555)
36. Louisiana
Source: sfe-co2 / iStock Editorial via Getty Images
- Change in homelessness, 2018-2023: +3.6% (+110 people in total)
- Total homelessness, 2023: 3,169 — or 6.9 per 10,000 people (3rd lowest)
- Total homelessness, 2018: 3,059 — or 6.6 per 10,000 people (2nd lowest)
- Median household income growth: 20.1% — 11th lowest (2017: $46,145; 2022: $55,416)
- Change in state population: -1.9% (2018: 4,659,978; 2023: 4,573,749)
35. North Carolina
Source: Hagercod42 / iStock Editorial via Getty Images
- Change in homelessness, 2018-2023: +5.2% (+486 people in total)
- Total homelessness, 2023: 9,754 — or 9.0 per 10,000 people (15th lowest)
- Total homelessness, 2018: 9,268 — or 8.9 per 10,000 people (17th lowest)
- Median household income growth: 27.9% — 11th highest (2017: $52,752; 2022: $67,481)
- Change in state population: +4.4% (2018: 10,383,620; 2023: 10,835,491)
34. Michigan
Source: Spencer Platt / Getty Images News via Getty Images
- Change in homelessness, 2018-2023: +7.7% (+646 people in total)
- Total homelessness, 2023: 8,997 — or 9.0 per 10,000 people (12th lowest)
- Total homelessness, 2018: 8,351 — or 8.4 per 10,000 people (12th lowest)
- Median household income growth: 22.0% — 21st lowest (2017: $54,909; 2022: $66,986)
- Change in state population: +0.4% (2018: 9,995,915; 2023: 10,037,261)
33. Texas
Source: Spencer Platt / Getty Images News via Getty Images
- Change in homelessness, 2018-2023: +8.2% (+2,067 people in total)
- Total homelessness, 2023: 27,377 — or 9.0 per 10,000 people (14th lowest)
- Total homelessness, 2018: 25,310 — or 8.8 per 10,000 people (16th lowest)
- Median household income growth: 22.1% — 22nd lowest (2017: $59,206; 2022: $72,284)
- Change in state population: +6.3% (2018: 28,701,845; 2023: 30,503,301)
32. New Jersey
Source: teknorat / Flickr
- Change in homelessness, 2018-2023: +9.2% (+866 people in total)
- Total homelessness, 2023: 10,264 — or 11.0 per 10,000 people (25th lowest)
- Total homelessness, 2018: 9,398 — or 10.5 per 10,000 people (24th lowest)
- Median household income growth: 20.3% — 12th lowest (2017: $80,088; 2022: $96,346)
- Change in state population: +4.3% (2018: 8,908,520; 2023: 9,290,841)
31. South Dakota

Source: addkm / Shutterstock.com
- Change in homelessness, 2018-2023: +10.6% (+123 people in total)
- Total homelessness, 2023: 1,282 — or 13.9 per 10,000 people (19th highest)
- Total homelessness, 2018: 1,159 — or 13.1 per 10,000 people (16th highest)
- Median household income growth: 23.4% — 22nd highest (2017: $56,521; 2022: $69,728)
- Change in state population: +4.2% (2018: 882,235; 2023: 919,318)
30. Ohio
Source: Jason Whitman / iStock Editorial via Getty Images
- Change in homelessness, 2018-2023: +11.1% (+1,137 people in total)
- Total homelessness, 2023: 11,386 — or 9.7 per 10,000 people (19th lowest)
- Total homelessness, 2018: 10,249 — or 8.8 per 10,000 people (15th lowest)
- Median household income growth: 21.7% — 19th lowest (2017: $54,021; 2022: $65,720)
- Change in state population: +0.8% (2018: 11,689,442; 2023: 11,785,935)
29. Illinois
Source: davidwilson1949 / Flickr
- Change in homelessness, 2018-2023: +12.3% (+1,304 people in total)
- Total homelessness, 2023: 11,947 — or 9.5 per 10,000 people (18th lowest)
- Total homelessness, 2018: 10,643 — or 8.4 per 10,000 people (11th lowest)
- Median household income growth: 21.8% — 20th lowest (2017: $62,992; 2022: $76,708)
- Change in state population: -1.5% (2018: 12,741,080; 2023: 12,549,689)
28. New York
Source: ShutterWorx / iStock Unreleased via Getty Images
- Change in homelessness, 2018-2023: +12.3% (+11,303 people in total)
- Total homelessness, 2023: 103,200 — or 52.7 per 10,000 people (2nd highest)
- Total homelessness, 2018: 91,897 — or 47.0 per 10,000 people (2nd highest)
- Median household income growth: 22.6% — 25th lowest (2017: $64,894; 2022: $79,557)
- Change in state population: +0.1% (2018: 19,542,209; 2023: 19,571,216)
27. Virginia
Source: John M. Chase / iStock Unreleased via Getty Images
- Change in homelessness, 2018-2023: +13.2% (+786 people in total)
- Total homelessness, 2023: 6,761 — or 7.8 per 10,000 people (5th lowest)
- Total homelessness, 2018: 5,975 — or 7.0 per 10,000 people (4th lowest)
- Median household income growth: 20.0% — 10th lowest (2017: $71,535; 2022: $85,873)
- Change in state population: +2.3% (2018: 8,517,685; 2023: 8,715,698)
26. West Virginia
Source: Wirestock / iStock Editorial via Getty Images
- Change in homelessness, 2018-2023: +13.9% (+173 people in total)
- Total homelessness, 2023: 1,416 — or 8.0 per 10,000 people (6th lowest)
- Total homelessness, 2018: 1,243 — or 6.9 per 10,000 people (3rd lowest)
- Median household income growth: 25.0% — 18th highest (2017: $43,469; 2022: $54,329)
- Change in state population: -2.0% (2018: 1,805,832; 2023: 1,770,071)
25. Missouri
Source: komunews / Flickr
- Change in homelessness, 2018-2023: +14.0% (+825 people in total)
- Total homelessness, 2023: 6,708 — or 10.8 per 10,000 people (24th lowest)
- Total homelessness, 2018: 5,883 — or 9.6 per 10,000 people (21st lowest)
- Median household income growth: 21.0% — 16th lowest (2017: $53,578; 2022: $64,811)
- Change in state population: +1.1% (2018: 6,126,452; 2023: 6,196,156)
24. Idaho
Source: Ground Picture / Shutterstock.com
- Change in homelessness, 2018-2023: +14.2% (+286 people in total)
- Total homelessness, 2023: 2,298 — or 11.7 per 10,000 people (24th highest)
- Total homelessness, 2018: 2,012 — or 11.5 per 10,000 people (22nd highest)
- Median household income growth: 39.4% — the highest (2017: $52,225; 2022: $72,785)
- Change in state population: +12.0% (2018: 1,754,208; 2023: 1,964,726)
23. Indiana
Source: Gerry Justice / Getty Images
- Change in homelessness, 2018-2023: +14.4% (+759 people in total)
- Total homelessness, 2023: 6,017 — or 8.8 per 10,000 people (11th lowest)
- Total homelessness, 2018: 5,258 — or 7.9 per 10,000 people (9th lowest)
- Median household income growth: 23.3% — 23rd highest (2017: $54,181; 2022: $66,785)
- Change in state population: +2.5% (2018: 6,691,878; 2023: 6,862,199)
22. Nevada
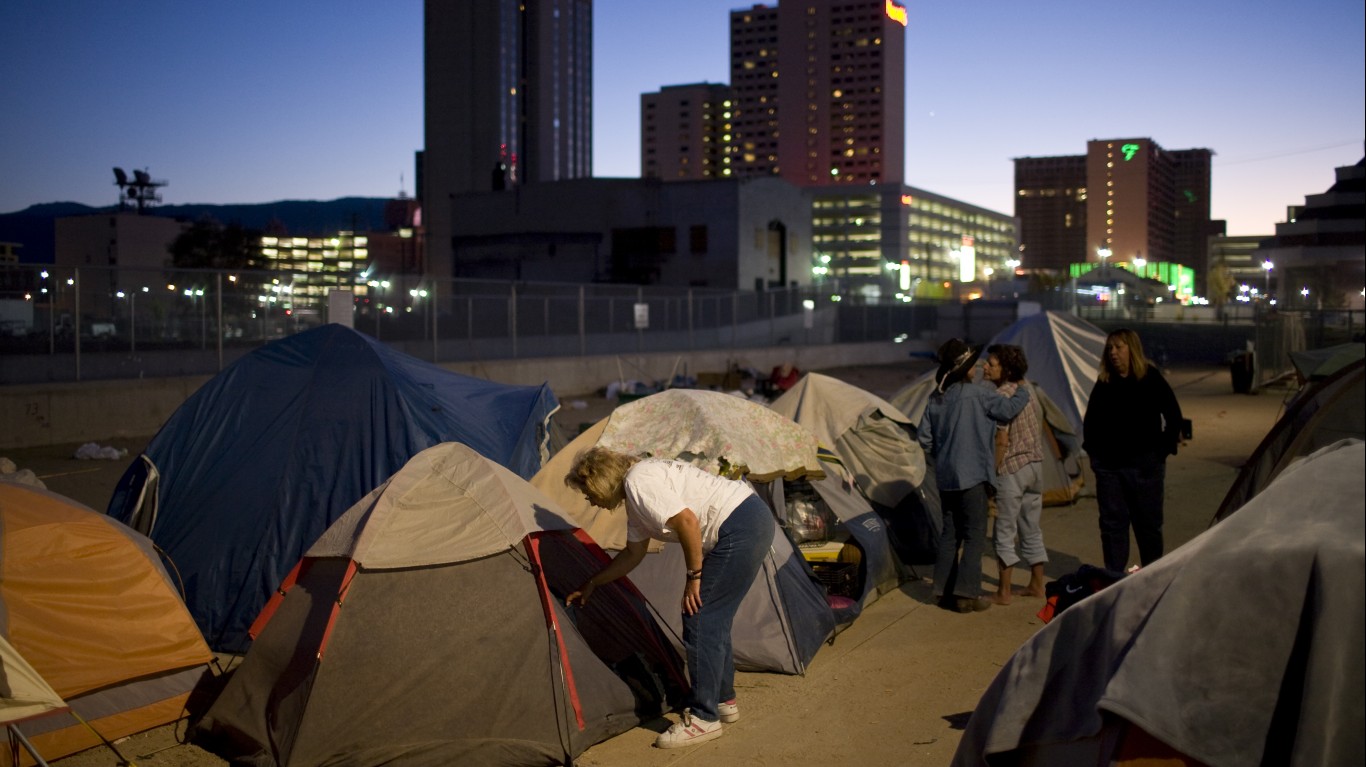
Source: Max Whittaker / Getty Images News via Getty Images
- Change in homelessness, 2018-2023: +14.9% (+1,122 people in total)
- Total homelessness, 2023: 8,666 — or 27.1 per 10,000 people (11th highest)
- Total homelessness, 2018: 7,544 — or 24.9 per 10,000 people (9th highest)
- Median household income growth: 24.7% — 19th highest (2017: $58,003; 2022: $72,333)
- Change in state population: +5.3% (2018: 3,034,392; 2023: 3,194,176)
21. Delaware
Source: Followtheflow / Shutterstock.com
- Change in homelessness, 2018-2023: +15.1% (+163 people in total)
- Total homelessness, 2023: 1,245 — or 12.1 per 10,000 people (23rd highest)
- Total homelessness, 2018: 1,082 — or 11.2 per 10,000 people (23rd highest)
- Median household income growth: 30.7% — 4th highest (2017: $62,852; 2022: $82,174)
- Change in state population: +6.7% (2018: 967,171; 2023: 1,031,890)
20. Minnesota

Source: Stephen Maturen / Getty Images News via Getty Images
- Change in homelessness, 2018-2023: +15.9% (+1,150 people in total)
- Total homelessness, 2023: 8,393 — or 14.6 per 10,000 people (18th highest)
- Total homelessness, 2018: 7,243 — or 12.9 per 10,000 people (17th highest)
- Median household income growth: 20.4% — 13th lowest (2017: $68,388; 2022: $82,338)
- Change in state population: +2.3% (2018: 5,611,179; 2023: 5,737,915)
19. Tennessee
Source: Spencer Platt / Getty Images News via Getty Images
- Change in homelessness, 2018-2023: +16.9% (+1,332 people in total)
- Total homelessness, 2023: 9,215 — or 12.9 per 10,000 people (21st highest)
- Total homelessness, 2018: 7,883 — or 11.6 per 10,000 people (21st highest)
- Median household income growth: 27.1% — 14th highest (2017: $51,340; 2022: $65,254)
- Change in state population: +5.3% (2018: 6,770,010; 2023: 7,126,489)
18. Kansas
Source: Stas_V / iStock via Getty Images
- Change in homelessness, 2018-2023: +19.0% (+420 people in total)
- Total homelessness, 2023: 2,636 — or 9.0 per 10,000 people (13th lowest)
- Total homelessness, 2018: 2,216 — or 7.6 per 10,000 people (7th lowest)
- Median household income growth: 22.2% — 24th lowest (2017: $56,422; 2022: $68,925)
- Change in state population: +1.0% (2018: 2,911,510; 2023: 2,940,546)
17. Oklahoma
Source: pixelpackr / Flickr
- Change in homelessness, 2018-2023: +20.1% (+777 people in total)
- Total homelessness, 2023: 4,648 — or 11.5 per 10,000 people (25th highest)
- Total homelessness, 2018: 3,871 — or 9.8 per 10,000 people (22nd lowest)
- Median household income growth: 19.2% — 7th lowest (2017: $50,051; 2022: $59,673)
- Change in state population: +2.8% (2018: 3,943,079; 2023: 4,053,824)
16. Washington

Source: perspective / Flickr
- Change in homelessness, 2018-2023: +25.7% (+5,732 people in total)
- Total homelessness, 2023: 28,036 — or 35.9 per 10,000 people (7th highest)
- Total homelessness, 2018: 22,304 — or 29.6 per 10,000 people (6th highest)
- Median household income growth: 28.6% — 9th highest (2017: $70,979; 2022: $91,306)
- Change in state population: +3.7% (2018: 7,535,591; 2023: 7,812,880)
15. Utah
Source: Joey Ingelhart / iStock via Getty Images
- Change in homelessness, 2018-2023: +28.2% (+811 people in total)
- Total homelessness, 2023: 3,687 — or 10.8 per 10,000 people (23rd lowest)
- Total homelessness, 2018: 2,876 — or 9.1 per 10,000 people (20th lowest)
- Median household income growth: 30.4% — 5th highest (2017: $68,358; 2022: $89,168)
- Change in state population: +8.1% (2018: 3,161,105; 2023: 3,417,734)
14. Kentucky

Source: JerryGrugin / iStock Editorial via Getty Images
- Change in homelessness, 2018-2023: +29.2% (+1,078 people in total)
- Total homelessness, 2023: 4,766 — or 10.5 per 10,000 people (22nd lowest)
- Total homelessness, 2018: 3,688 — or 8.3 per 10,000 people (10th lowest)
- Median household income growth: 22.7% — 24th highest (2017: $48,375; 2022: $59,341)
- Change in state population: +1.3% (2018: 4,468,402; 2023: 4,526,154)
13. Georgia
Source: editor / Flickr
- Change in homelessness, 2018-2023: +29.4% (+2,795 people in total)
- Total homelessness, 2023: 12,294 — or 11.1 per 10,000 people (26th highest)
- Total homelessness, 2018: 9,499 — or 9.0 per 10,000 people (19th lowest)
- Median household income growth: 29.6% — 6th highest (2017: $56,183; 2022: $72,837)
- Change in state population: +4.8% (2018: 10,519,475; 2023: 11,029,227)
12. Alaska

Source: alaska-landmine / Flickr
- Change in homelessness, 2018-2023: +29.7% (+598 people in total)
- Total homelessness, 2023: 2,614 — or 35.6 per 10,000 people (8th highest)
- Total homelessness, 2018: 2,016 — or 27.3 per 10,000 people (8th highest)
- Median household income growth: 20.4% — 14th lowest (2017: $73,181; 2022: $88,121)
- Change in state population: -0.5% (2018: 737,438; 2023: 733,406)
11. Colorado

Source: Peeter Viisimaa / iStock Unreleased via Getty Images
- Change in homelessness, 2018-2023: +33.0% (+3,582 people in total)
- Total homelessness, 2023: 14,439 — or 24.6 per 10,000 people (12th highest)
- Total homelessness, 2018: 10,857 — or 19.1 per 10,000 people (11th highest)
- Median household income growth: 29.2% — 7th highest (2017: $69,117; 2022: $89,302)
- Change in state population: +3.2% (2018: 5,695,564; 2023: 5,877,610)
10. Oregon
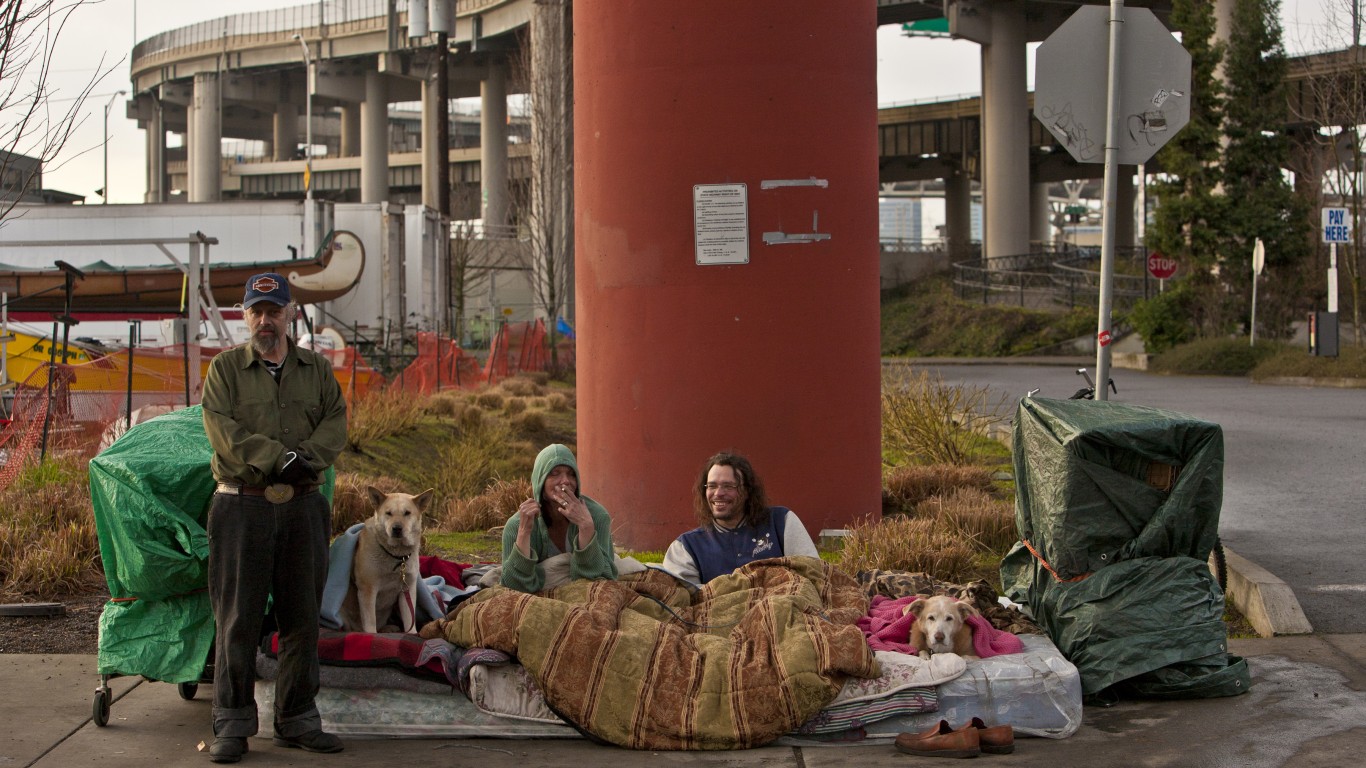
Source: George Rose / Getty Images
- Change in homelessness, 2018-2023: +39.1% (+5,666 people in total)
- Total homelessness, 2023: 20,142 — or 47.6 per 10,000 people (4th highest)
- Total homelessness, 2018: 14,476 — or 34.5 per 10,000 people (4th highest)
- Median household income growth: 25.7% — 17th highest (2017: $60,212; 2022: $75,657)
- Change in state population: +1.0% (2018: 4,190,713; 2023: 4,233,358)
9. California
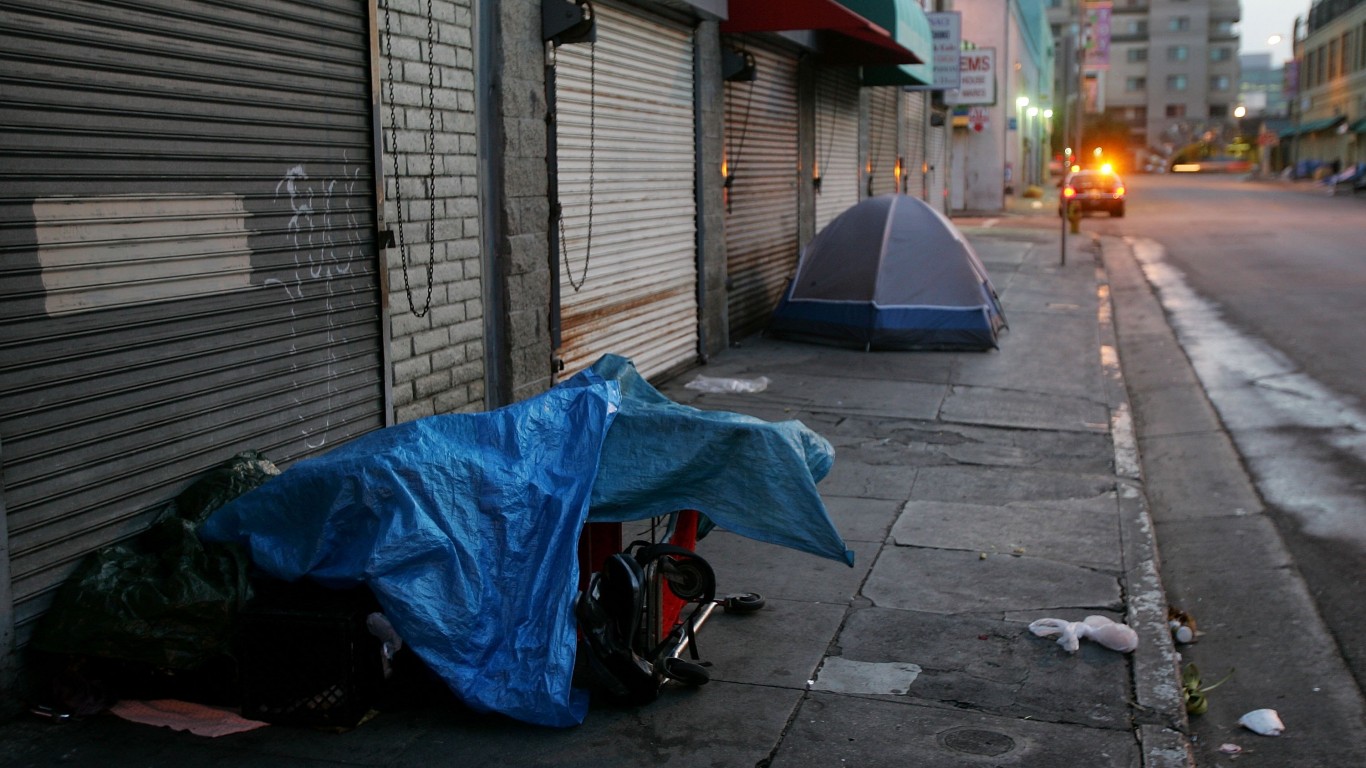
Source: David McNew / Getty Images News via Getty Images
- Change in homelessness, 2018-2023: +39.6% (+51,427 people in total)
- Total homelessness, 2023: 181,399 — or 46.6 per 10,000 people (5th highest)
- Total homelessness, 2018: 129,972 — or 32.9 per 10,000 people (5th highest)
- Median household income growth: 27.5% — 13th highest (2017: $71,805; 2022: $91,551)
- Change in state population: -1.5% (2018: 39,557,045; 2023: 38,965,193)
8. Arizona
Source: APIWAN BORRIKONRATCHATA / Shutterstock.com
- Change in homelessness, 2018-2023: +44.3% (+4,372 people in total)
- Total homelessness, 2023: 14,237 — or 19.2 per 10,000 people (14th highest)
- Total homelessness, 2018: 9,865 — or 13.8 per 10,000 people (14th highest)
- Median household income growth: 31.8% — 2nd highest (2017: $56,581; 2022: $74,568)
- Change in state population: +3.6% (2018: 7,171,646; 2023: 7,431,344)
7. North Dakota
Source: Mikael Damkier / Shutterstock.com
- Change in homelessness, 2018-2023: +44.6% (+242 people in total)
- Total homelessness, 2023: 784 — or 10.0 per 10,000 people (21st lowest)
- Total homelessness, 2018: 542 — or 7.1 per 10,000 people (6th lowest)
- Median household income growth: 16.4% — 3rd lowest (2017: $61,843; 2022: $71,970)
- Change in state population: +3.1% (2018: 760,077; 2023: 783,926)
6. New Mexico
Source: Spencer Platt / Getty Images News via Getty Images
- Change in homelessness, 2018-2023: +50.6% (+1,291 people in total)
- Total homelessness, 2023: 3,842 — or 18.2 per 10,000 people (15th highest)
- Total homelessness, 2018: 2,551 — or 12.2 per 10,000 people (19th highest)
- Median household income growth: 27.8% — 12th highest (2017: $46,744; 2022: $59,726)
- Change in state population: +0.9% (2018: 2,095,428; 2023: 2,114,371)
5. Montana

Source: austinvalley / Flickr
- Change in homelessness, 2018-2023: 55.0% — (+773 people in total)
- Total homelessness, 2023: 2,178 — or 19.2 per 10,000 people (13th highest)
- Total homelessness, 2018: 1,405 — or 13.2 per 10,000 people (15th highest)
- Median household income growth: 26.7% — 16th highest (2017: $53,386; 2022: $67,631)
- Change in state population: +6.6% (2018: 1,062,305; 2023: 1,132,812)
4. Rhode Island

Source: duchy / Shutterstock.com
- Change in homelessness, 2018-2023: +64.4% (+709 people in total)
- Total homelessness, 2023: 1,810 — or 16.5 per 10,000 people (17th highest)
- Total homelessness, 2018: 1,101 — or 10.4 per 10,000 people (23rd lowest)
- Median household income growth: 28.2% — 10th highest (2017: $63,870; 2022: $81,854)
- Change in state population: +3.7% (2018: 1,057,315; 2023: 1,095,962)
3. New Hampshire

Source: manchesterlibrary / Flickr
- Change in homelessness, 2018-2023: +68.3% (+991 people in total)
- Total homelessness, 2023: 2,441 — or 17.4 per 10,000 people (16th highest)
- Total homelessness, 2018: 1,450 — or 10.7 per 10,000 people (26th highest)
- Median household income growth: 22.6% — 26th highest (2017: $73,381; 2022: $89,992)
- Change in state population: +3.4% (2018: 1,356,458; 2023: 1,402,054)
2. Maine
Source: Roman Bodnarchuk / Shutterstock.com
- Change in homelessness, 2018-2023: +69.2% (+1,742 people in total)
- Total homelessness, 2023: 4,258 — or 30.5 per 10,000 people (9th highest)
- Total homelessness, 2018: 2,516 — or 18.8 per 10,000 people (12th highest)
- Median household income growth: 23.6% — 21st highest (2017: $56,277; 2022: $69,543)
- Change in state population: +4.3% (2018: 1,338,404; 2023: 1,395,722)
1. Vermont

Source: Srdjan Randjelovic / Shutterstock.com
- Change in homelessness, 2018-2023: +155.2% (+2,004 people in total)
- Total homelessness, 2023: 3,295 — or 50.9 per 10,000 people (3rd highest)
- Total homelessness, 2018: 1,291 — or 20.6 per 10,000 people (10th highest)
- Median household income growth: 28.7% — 8th highest (2017: $57,513; 2022: $73,991)
- Change in state population: +3.4% (2018: 626,299; 2023: 647,464)
Sponsored: Want to Retire Early? Start Here
Want retirement to come a few years earlier than you’d planned? Orare you ready to retire now, but want an extra set of eyes on your finances?
Now you can speak with up to 3 financial experts in your area for FREE. By simply clicking here you can begin to match with financial professionals who can help you build your plan to retire early. And the best part? The first conversation with them is free.
Click here to match with up to 3 financial pros who would be excited to help you make financial decisions.
Thank you for reading! Have some feedback for us?
Contact the 24/7 Wall St. editorial team.
Editors' Picks