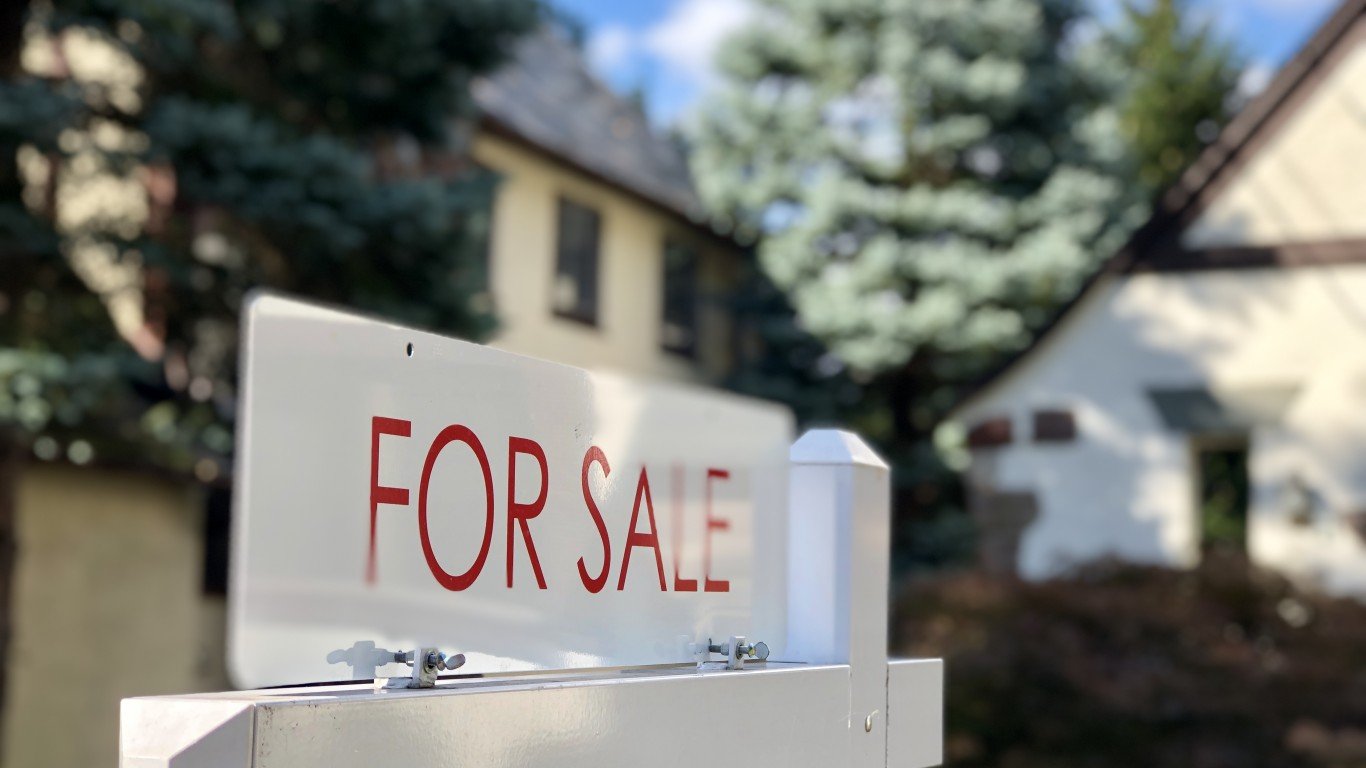
Mortgage rates have recently risen to levels not seen in over 20 years, with average 30-year fixed-rate mortgage interest rates climbing to over 7%, while the rates for borrowers who have low credit or high debt-to-income ratios is around 8%.
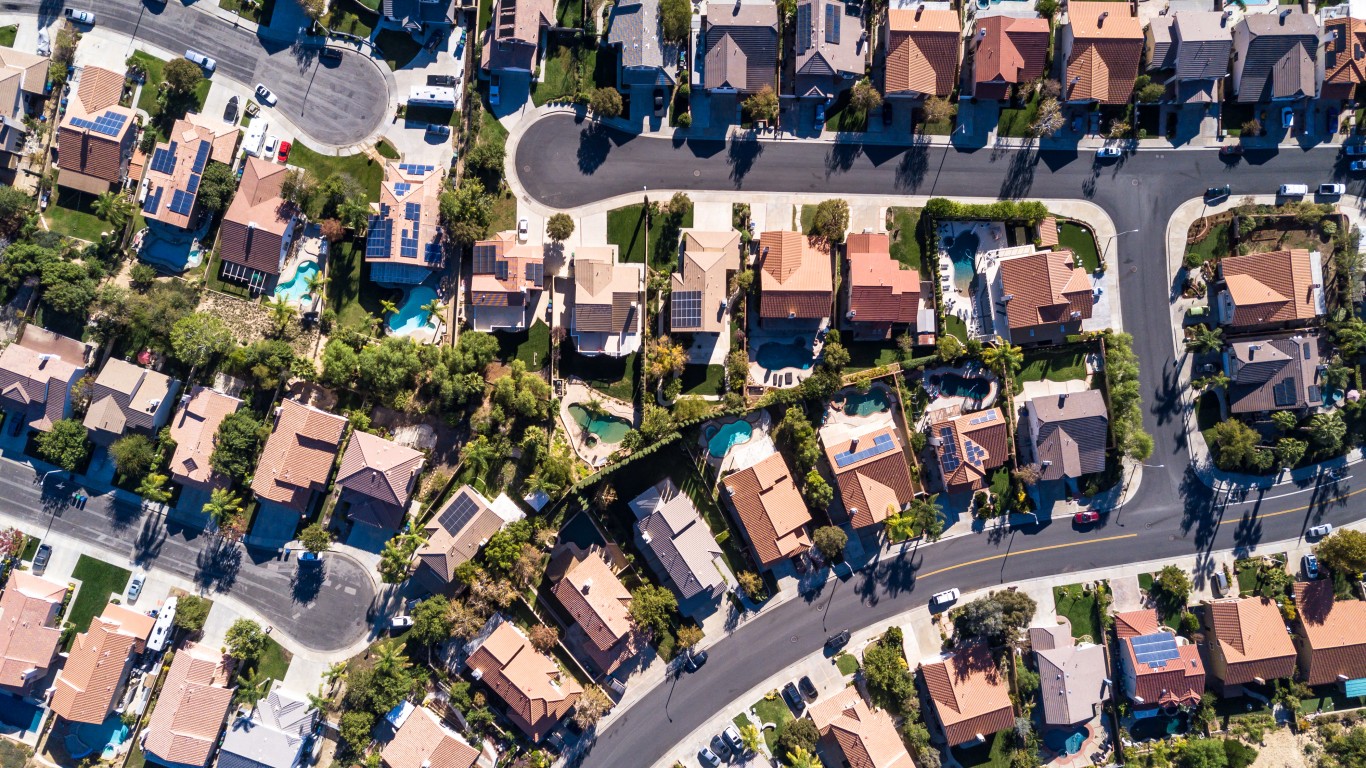
These increases are just another hurdle for potential homebuyers already contending with high housing prices and scarce inventory. The combination has led to a housing market that is the least affordable since 1984. (These are America’s 25 least affordable housing markets.)
To compare the current mortgage rate to other years in the United States, 24/7 Wall St reviewed data for 1999 to 2023 from the table, 30-Year Fixed Rate Mortgage Average in the United States, covering data from 1971 to 2023, compiled by the Federal Reserve Bank of St. Louis. We also calculated the average sale price for homes sold in each of the years on this list by reviewing quarterly median sale prices in the United States also from the Federal Reserve Bank of St. Louis.
From 2000 to 2015, average mortgage rates decreased steadily, from 8.19% to 4.09%, and hovered under 5% until 2020. Mortgage rates hit historic lows during the pandemic, dropping below 3% for the first time ever in July 2020. However, those rates did not last long. The Federal Reserve raised interest rates multiple times to combat inflation in 2022 and the rate hikes have continued this year.
The current housing market is reminiscent of the early 80s market, when the Fed was battling double-digit inflation, and mortgage rates reached a record 18.5%. Although buyers today have much lower interest rates, average home prices have increased steadily from around $68,900 in 1981 to $422,550 in 2023. (The cost of housing has skyrocketed in these major U.S. cities.)
Click here to see the highest mortgage rate in decades compared to the last 25 years.

1999
> Avg fixed 30-year mortgage rate: 7.44% – #2 highest between 1999 and 2023
> Peak rate: 8.15% in Aug
> Avg sale price of homes sold in US: $160,125 -#25
[in-text-ad]

2000
> Avg fixed 30-year mortgage rate: 8.05% – #1 highest between 1999 and 2023
> Peak rate: 8.64% in May
> Avg sale price of homes sold in US: $167,550 -#24
[recirclink id=1253818]
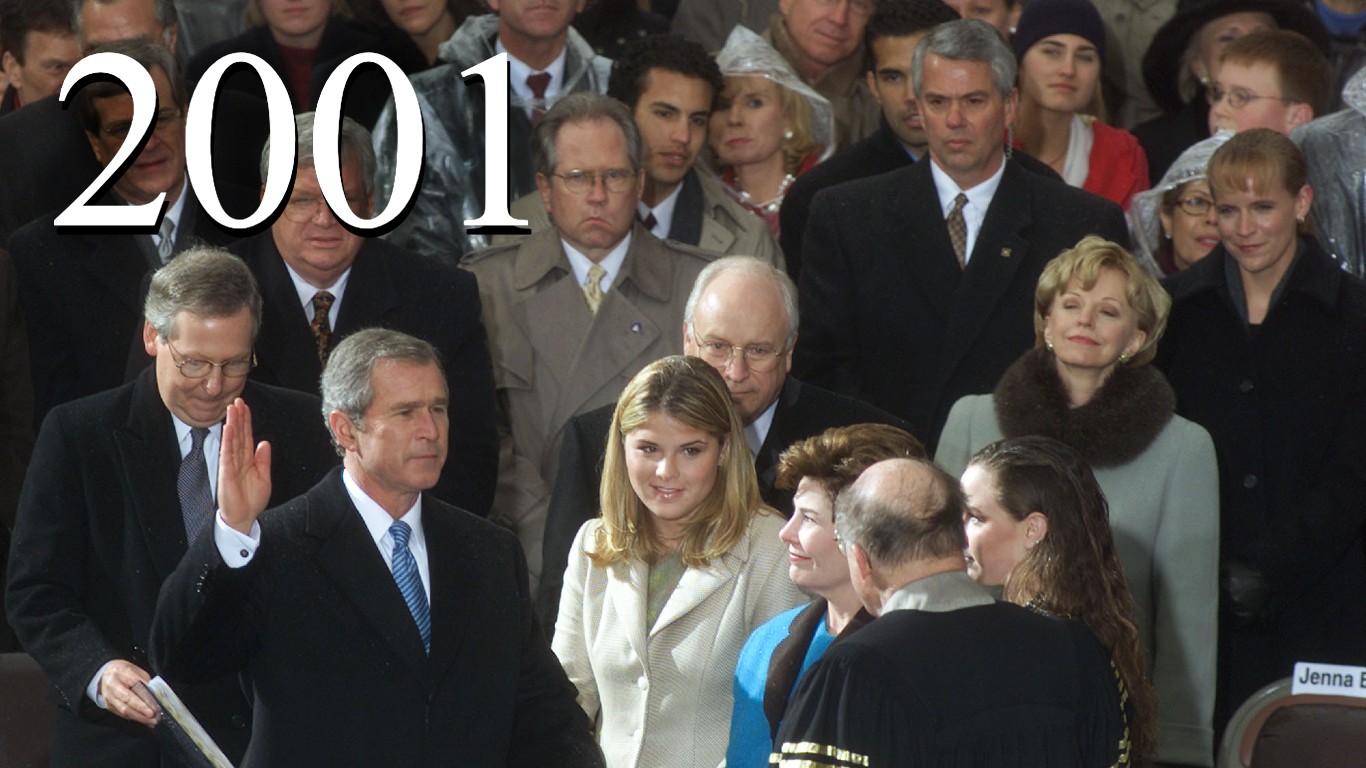
2001
> Avg fixed 30-year mortgage rate: 6.97% – #3 highest between 1999 and 2023
> Peak rate: 7.24% in June
> Avg sale price of homes sold in US: $173,100 -#23
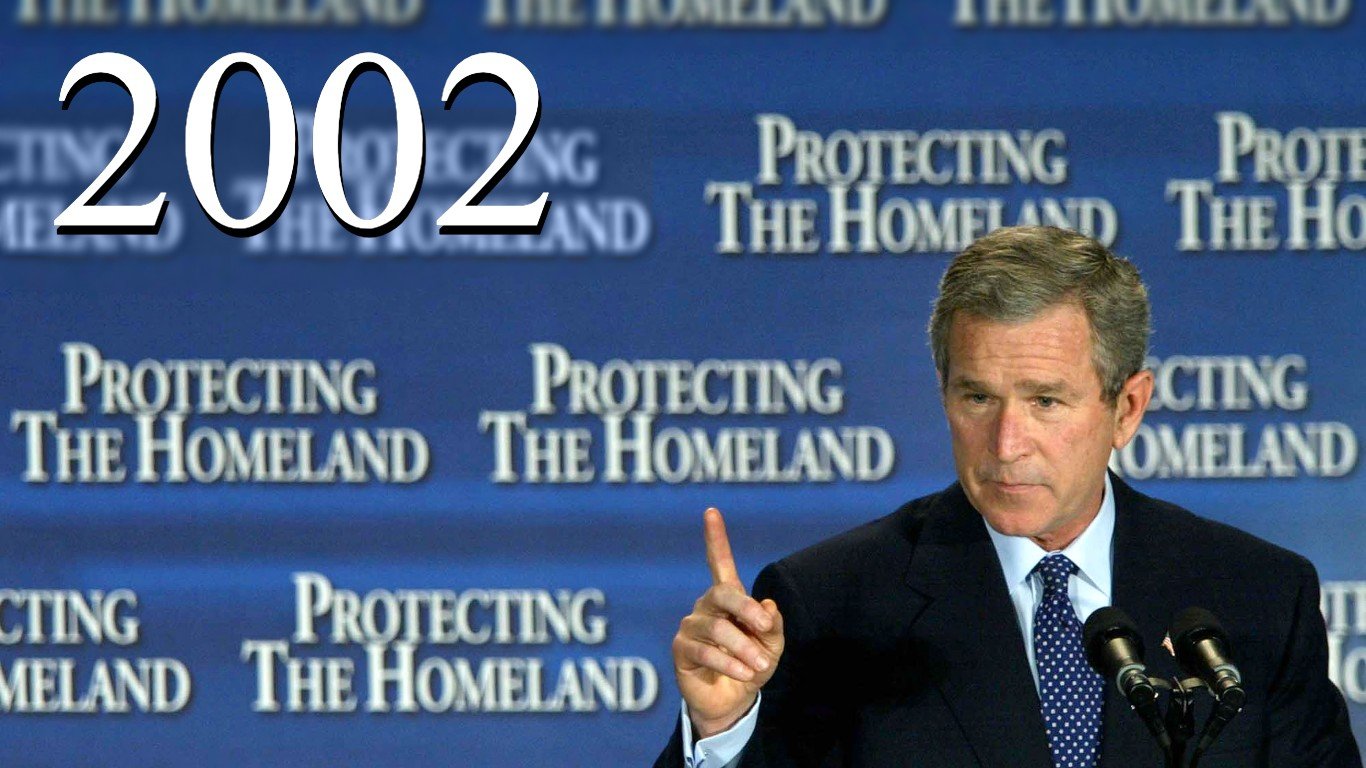
2002
> Avg fixed 30-year mortgage rate: 6.54% – #4 highest between 1999 and 2023
> Peak rate: 7.18% in Mar
> Avg sale price of homes sold in US: $186,025 -#22
[in-text-ad-2]

2003
> Avg fixed 30-year mortgage rate: 5.83% – #11 highest between 1999 and 2023
> Peak rate: 6.44% in Sep
> Avg sale price of homes sold in US: $192,125 -#21

2004
> Avg fixed 30-year mortgage rate: 5.84% – #10 highest between 1999 and 2023
> Peak rate: 6.34% in May
> Avg sale price of homes sold in US: $218,150 -#19
[in-text-ad]

2005
> Avg fixed 30-year mortgage rate: 5.87% – #9 highest between 1999 and 2023
> Peak rate: 6.37% in Nov
> Avg sale price of homes sold in US: $236,550 -#15
[recirclink id=1297341]

2006
> Avg fixed 30-year mortgage rate: 6.41% – #6 highest between 1999 and 2023
> Peak rate: 6.8% in July
> Avg sale price of homes sold in US: $243,750 -#14

2007
> Avg fixed 30-year mortgage rate: 6.34% – #7 highest between 1999 and 2023
> Peak rate: 6.74% in June
> Avg sale price of homes sold in US: $244,950 -#12
[in-text-ad-2]

2008
> Avg fixed 30-year mortgage rate: 6.03% – #8 highest between 1999 and 2023
> Peak rate: 6.63% in July
> Avg sale price of homes sold in US: $229,550 -#16
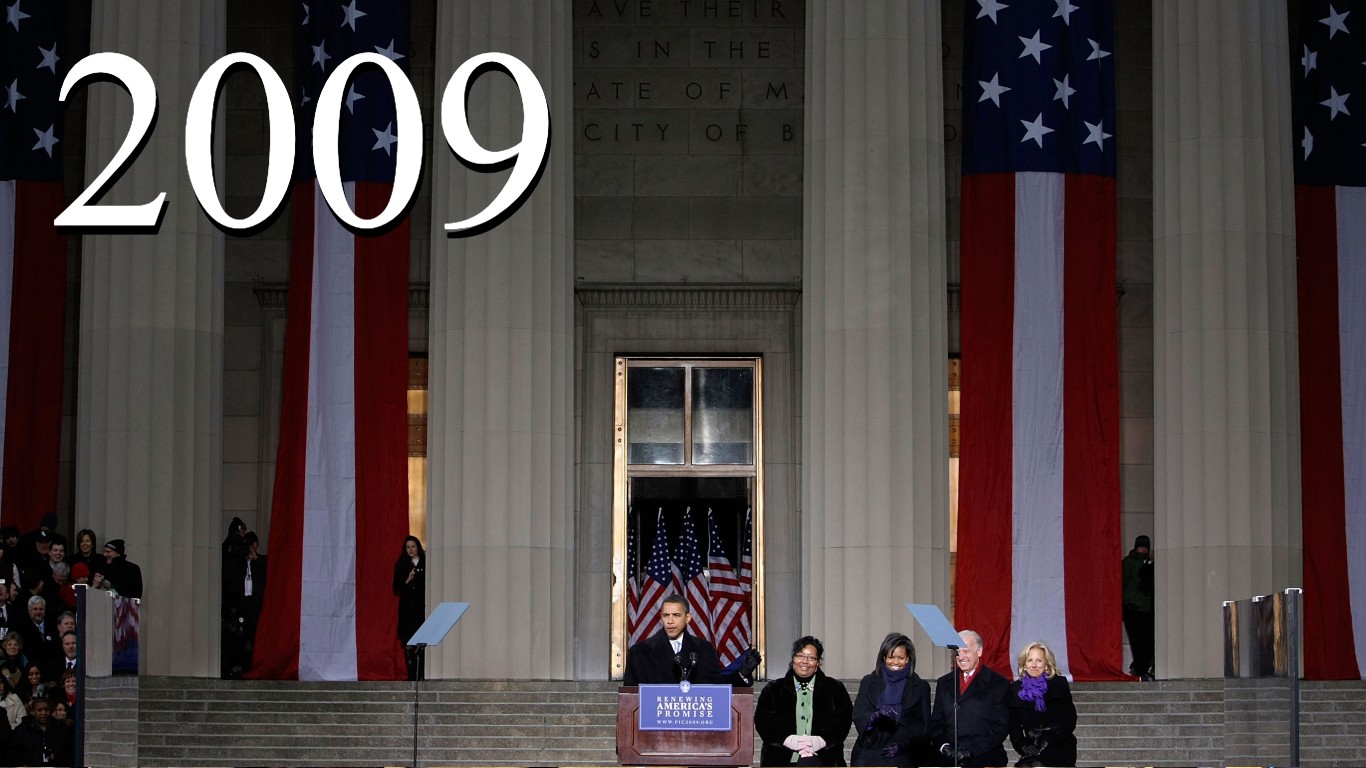
2009
> Avg fixed 30-year mortgage rate: 5.04% – #13 highest between 1999 and 2023
> Peak rate: 5.59% in June
> Avg sale price of homes sold in US: $215,650 -#20
[in-text-ad]

2010
> Avg fixed 30-year mortgage rate: 4.69% – #14 highest between 1999 and 2023
> Peak rate: 5.21% in Apr
> Avg sale price of homes sold in US: $222,700 -#18
[recirclink id=1234766]

2011
> Avg fixed 30-year mortgage rate: 4.45% – #16 highest between 1999 and 2023
> Peak rate: 5.05% in Feb
> Avg sale price of homes sold in US: $224,900 -#17

2012
> Avg fixed 30-year mortgage rate: 3.66% – #22 highest between 1999 and 2023
> Peak rate: 4.08% in Mar
> Avg sale price of homes sold in US: $244,400 -#13
[in-text-ad-2]

2013
> Avg fixed 30-year mortgage rate: 3.98% – #19 highest between 1999 and 2023
> Peak rate: 4.58% in Aug
> Avg sale price of homes sold in US: $266,225 -#11

2014
> Avg fixed 30-year mortgage rate: 4.17% – #17 highest between 1999 and 2023
> Peak rate: 4.53% in Jan
> Avg sale price of homes sold in US: $285,775 -#10
[in-text-ad]

2015
> Avg fixed 30-year mortgage rate: 3.85% – #21 highest between 1999 and 2023
> Peak rate: 4.09% in July
> Avg sale price of homes sold in US: $294,150 -#9
[recirclink id=1253245]

2016
> Avg fixed 30-year mortgage rate: 3.65% – #23 highest between 1999 and 2023
> Peak rate: 4.32% in Dec
> Avg sale price of homes sold in US: $305,125 -#8

2017
> Avg fixed 30-year mortgage rate: 3.99% – #18 highest between 1999 and 2023
> Peak rate: 4.3% in Mar
> Avg sale price of homes sold in US: $322,425 -#6
[in-text-ad-2]

2018
> Avg fixed 30-year mortgage rate: 4.54% – #15 highest between 1999 and 2023
> Peak rate: 4.94% in Nov
> Avg sale price of homes sold in US: $325,275 -#5

2019
> Avg fixed 30-year mortgage rate: 3.94% – #20 highest between 1999 and 2023
> Peak rate: 4.51% in Jan
> Avg sale price of homes sold in US: $320,250 -#7
[in-text-ad]

2020
> Avg fixed 30-year mortgage rate: 3.11% – #24 highest between 1999 and 2023
> Peak rate: 3.72% in Jan
> Avg sale price of homes sold in US: $336,950 -#4
[recirclink id=1259901]

2021
> Avg fixed 30-year mortgage rate: 2.96% – #25 highest between 1999 and 2023
> Peak rate: 3.18% in Apr
> Avg sale price of homes sold in US: $396,800 -#3

2022
> Avg fixed 30-year mortgage rate: 5.34% – #12 highest between 1999 and 2023
> Peak rate: 7.08% in Oct
> Avg sale price of homes sold in US: $457,475 -#1
[in-text-ad-2]

2023
> Avg fixed 30-year mortgage rate: 6.54% – #4 highest between 1999 and 2023
> Peak rate: 7.09% in Aug
> Avg sale price of homes sold in US: $422,550 -#2
Contact [email protected] for any questions or corrections.