The COVID increase detected in the U.S. this summer has continued to slow in recent weeks.
ER visits, hospital admissions, and deaths from COVID decreased across the U.S. over the week ending Sept. 16, according to the Centers for Disease Control and Prevention. However, new data on COVID deaths released by the CDC today indicated a slight increase over the past week. (Here are 25 college towns emerging as COVID hotspots.)
There were 19,674 new hospital admissions and 615 deaths linked to COVID across the U.S. over the week ending Sept. 16. For reference, in 2021, weekly hospital admissions peaked at over 150,000 and weekly deaths rose to 25,000 across the U.S.
While recent levels of COVID are nowhere near the point of over-stressing health systems like those seen during the worst of the pandemic, the start of the school year and increased travel plans during the fall months bring greater risk for respiratory illnesses. Also, the likelihood of infection varies widely across the country and the odds of needing to visit the hospital depend greatly on a variety of factors.
24/7 Tempo reviewed data on COVID-19 hospitalizations from the Centers for Disease Control and Prevention. Each state’s counties were ranked based on the number of new COVID-19 hospital admissions for every 100,000 county residents during the week Sept. 10-16, 2023. (COVID aside, as of last year, these were the healthiest counties in every state.)
Click here to see the counties where the COVID-19 increase is the worst in every state.
Click here for a detailed methodology.
Data on the percentage of staffed inpatient hospital beds occupied by confirmed COVID-19 patients over the same time period also came from the CDC. Data on total population is from the U.S. Census Bureau’s 2021 American Community Survey and are five-year estimates.

Alabama: Jefferson County
> New COVID hospital admissions per 100,000 week Sep 10-16: 10.0 (county); 6.9 (state)
> Inpatient beds occupied by COVID-19 patients: 3.0% (county); 3.3% (state)
> County population: 672,550
> County seat: Birmingham
[in-text-ad]

Alaska: Fairbanks North Star Borough
> New COVID hospital admissions per 100,000 week Sep 10-16: 8.1 (county); 4.9 (state)
> Inpatient beds occupied by COVID-19 patients: 3.9% (county); 2.9% (state)
> County population: 97,149
> County seat: Fairbanks
[recirclink id=1125679]

Arizona: Mohave County
> New COVID hospital admissions per 100,000 week Sep 10-16: 12.3 (county); 4.0 (state)
> Inpatient beds occupied by COVID-19 patients: 0.7% (county); 1.8% (state)
> County population: 211,274
> County seat: Kingman
Arkansas: Arkansas County
> New COVID hospital admissions per 100,000 week Sep 10-16: 33.1 (county); 8.3 (state)
> Inpatient beds occupied by COVID-19 patients: 2.1% (county); 3.7% (state)
> County population: 17,273
> County seat: DeWitt
[in-text-ad-2]

California: Sacramento County
> New COVID hospital admissions per 100,000 week Sep 10-16: 10.5 (county); 6.7 (state)
> Inpatient beds occupied by COVID-19 patients: 4.7% (county); 4.3% (state)
> County population: 1,571,767
> County seat: Sacramento
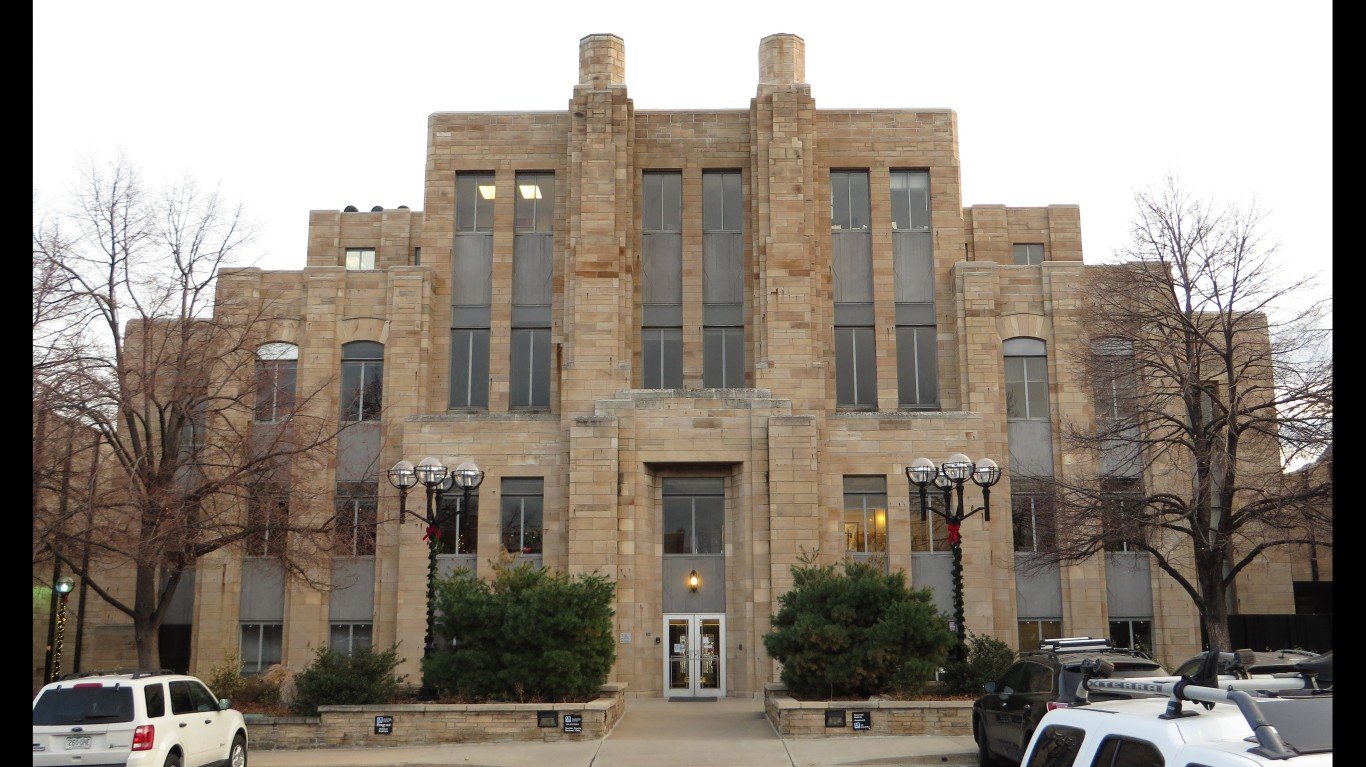
Colorado: Boulder County
> New COVID hospital admissions per 100,000 week Sep 10-16: 10.3 (county); 5.2 (state)
> Inpatient beds occupied by COVID-19 patients: 1.8% (county); 2.0% (state)
> County population: 328,713
> County seat: Boulder
[in-text-ad]

Connecticut: New Haven County
> New COVID hospital admissions per 100,000 week Sep 10-16: 7.1 (county); 5.9 (state)
> Inpatient beds occupied by COVID-19 patients: 2.6% (county); 3.3% (state)
> County population: 864,751
> County seat: New Haven
[recirclink id=1314987]

Delaware: New Castle County
> New COVID hospital admissions per 100,000 week Sep 10-16: 5.0 (county); 4.5 (state)
> Inpatient beds occupied by COVID-19 patients: 3.0% (county); 3.6% (state)
> County population: 567,769
> County seat: Wilmington
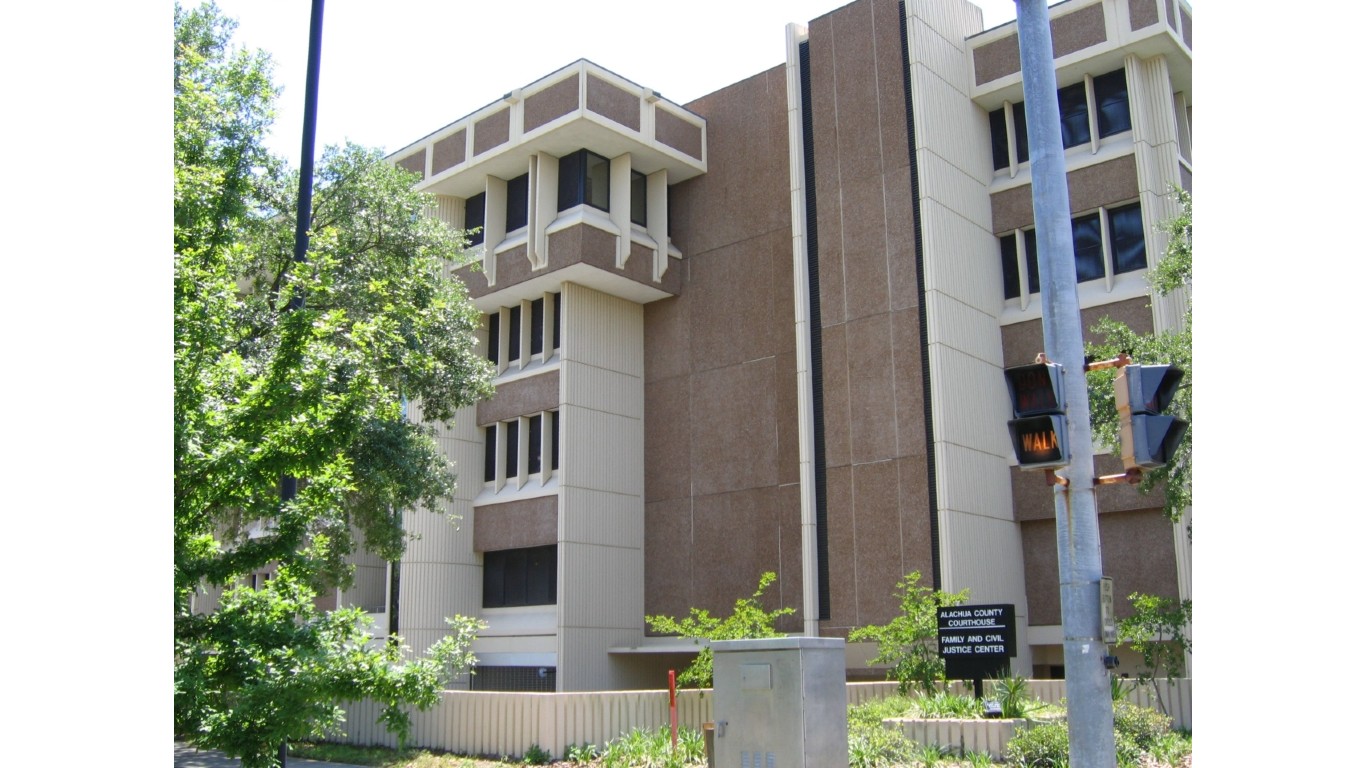
Florida: Alachua County
> New COVID hospital admissions per 100,000 week Sep 10-16: 18.0 (county); 9.4 (state)
> Inpatient beds occupied by COVID-19 patients: 4.7% (county); 4.2% (state)
> County population: 276,171
> County seat: Gainesville
[in-text-ad-2]

Georgia: Rabun County
> New COVID hospital admissions per 100,000 week Sep 10-16: 23.3 (county); 5.6 (state)
> Inpatient beds occupied by COVID-19 patients: 4.1% (county); 3.4% (state)
> County population: 16,731
> County seat: Clayton

Hawaii: Honolulu County
> New COVID hospital admissions per 100,000 week Sep 10-16: 7.1 (county); 6.4 (state)
> Inpatient beds occupied by COVID-19 patients: 3.6% (county); 4.6% (state)
> County population: 1,015,167
> County seat: Honolulu
[in-text-ad]
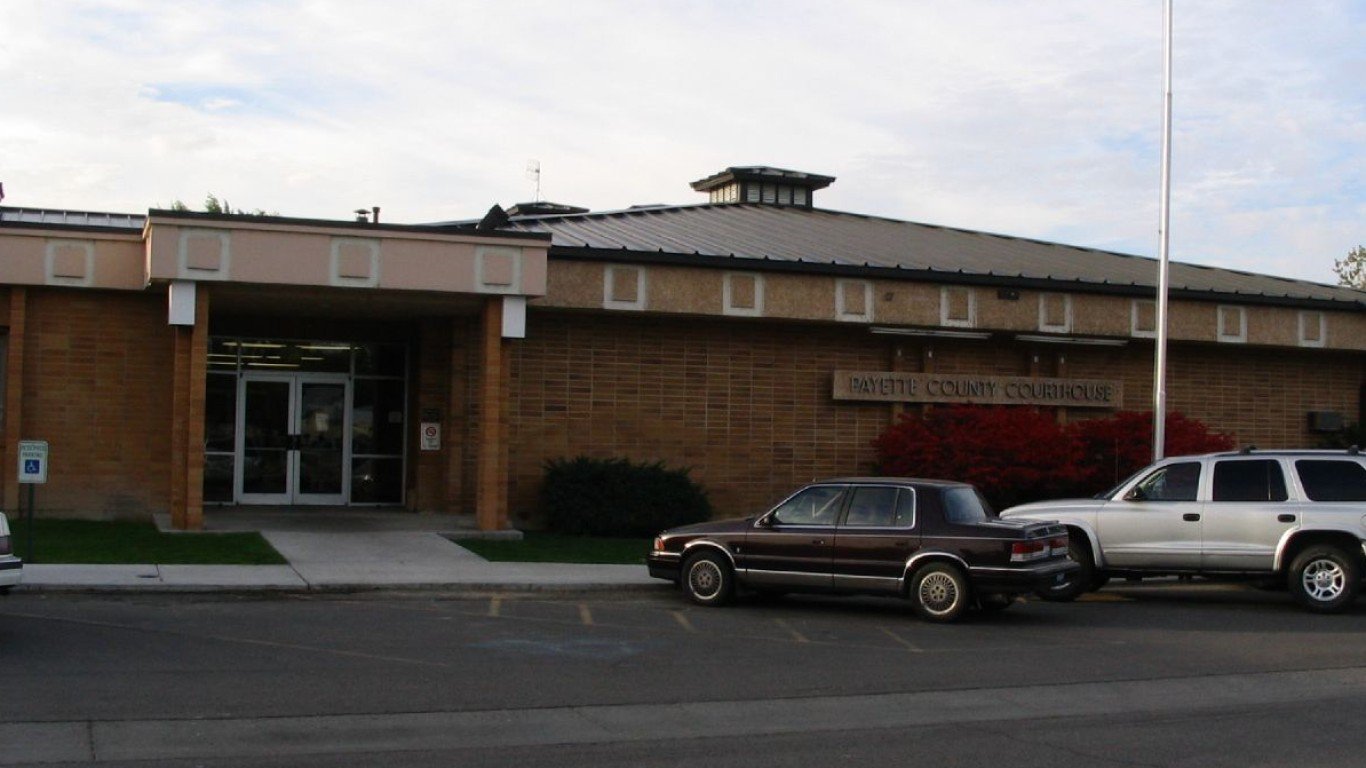
Idaho: Payette County
> New COVID hospital admissions per 100,000 week Sep 10-16: 7.2 (county); 4.5 (state)
> Inpatient beds occupied by COVID-19 patients: 1.0% (county); 3.0% (state)
> County population: 24,928
> County seat: Payette
[recirclink id=1315338]
Illinois: Henderson County
> New COVID hospital admissions per 100,000 week Sep 10-16: 15.3 (county); 5.3 (state)
> Inpatient beds occupied by COVID-19 patients: 3.3% (county); 2.7% (state)
> County population: 6,485
> County seat: Oquawka

Indiana: Tippecanoe County
> New COVID hospital admissions per 100,000 week Sep 10-16: 9.2 (county); 4.4 (state)
> Inpatient beds occupied by COVID-19 patients: 3.7% (county); 2.2% (state)
> County population: 185,961
> County seat: Lafayette
[in-text-ad-2]
Iowa: Lucas County
> New COVID hospital admissions per 100,000 week Sep 10-16: 19.9 (county); 4.9 (state)
> Inpatient beds occupied by COVID-19 patients: 0.5% (county); 2.5% (state)
> County population: 8,650
> County seat: Chariton

Kansas: Mitchell County
> New COVID hospital admissions per 100,000 week Sep 10-16: 16.3 (county); 4.1 (state)
> Inpatient beds occupied by COVID-19 patients: 1.3% (county); 2.4% (state)
> County population: 5,884
> County seat: Beloit
[in-text-ad]

Kentucky: Letcher County
> New COVID hospital admissions per 100,000 week Sep 10-16: 60.3 (county); 7.1 (state)
> Inpatient beds occupied by COVID-19 patients: 5.5% (county); 3.2% (state)
> County population: 21,784
> County seat: Whitesburg
[recirclink id=1125679]

Louisiana: Winn Parish
> New COVID hospital admissions per 100,000 week Sep 10-16: 14.4 (county); 5.9 (state)
> Inpatient beds occupied by COVID-19 patients: 0.6% (county); 3.0% (state)
> County population: 13,875
> County seat: Winnfield

Maine: Aroostook County
> New COVID hospital admissions per 100,000 week Sep 10-16: 8.9 (county); 3.5 (state)
> Inpatient beds occupied by COVID-19 patients: 2.5% (county); 2.9% (state)
> County population: 67,272
> County seat: Houlton
[in-text-ad-2]

Maryland: Allegany County
> New COVID hospital admissions per 100,000 week Sep 10-16: 9.2 (county); 4.5 (state)
> Inpatient beds occupied by COVID-19 patients: 3.2% (county); 3.9% (state)
> County population: 68,684
> County seat: Cumberland

Massachusetts: Worcester County
> New COVID hospital admissions per 100,000 week Sep 10-16: 7.2 (county); 6.6 (state)
> Inpatient beds occupied by COVID-19 patients: 1.8% (county); 2.5% (state)
> County population: 856,858
> County seat: Worcester
[in-text-ad]

Michigan: Grand Traverse County
> New COVID hospital admissions per 100,000 week Sep 10-16: 10.1 (county); 4.6 (state)
> Inpatient beds occupied by COVID-19 patients: 2.9% (county); 2.6% (state)
> County population: 94,562
> County seat: Traverse City
[recirclink id=1314987]

Minnesota: Otter Tail County
> New COVID hospital admissions per 100,000 week Sep 10-16: 10.8 (county); 3.7 (state)
> Inpatient beds occupied by COVID-19 patients: 6.3% (county); 2.4% (state)
> County population: 59,728
> County seat: Fergus Falls

Mississippi: Alcorn County
> New COVID hospital admissions per 100,000 week Sep 10-16: 23.1 (county); 5.3 (state)
> Inpatient beds occupied by COVID-19 patients: 7.0% (county); 2.9% (state)
> County population: 34,964
> County seat: Corinth
[in-text-ad-2]

Missouri: Buchanan County
> New COVID hospital admissions per 100,000 week Sep 10-16: 14.6 (county); 7.2 (state)
> Inpatient beds occupied by COVID-19 patients: 3.2% (county); 3.2% (state)
> County population: 85,545
> County seat: St. Joseph

Montana: Fergus County
> New COVID hospital admissions per 100,000 week Sep 10-16: 17.3 (county); 8.1 (state)
> Inpatient beds occupied by COVID-19 patients: 0.0% (county); 2.7% (state)
> County population: 11,464
> County seat: Lewistown
[in-text-ad]

Nebraska: Hall County
> New COVID hospital admissions per 100,000 week Sep 10-16: 11.5 (county); 4.0 (state)
> Inpatient beds occupied by COVID-19 patients: 1.2% (county); 1.7% (state)
> County population: 62,616
> County seat: Grand Island
[recirclink id=1125679]

Nevada: Washoe County
> New COVID hospital admissions per 100,000 week Sep 10-16: 6.2 (county); 4.5 (state)
> Inpatient beds occupied by COVID-19 patients: 2.8% (county); 2.4% (state)
> County population: 479,758
> County seat: Reno

New Hampshire: Cheshire County
> New COVID hospital admissions per 100,000 week Sep 10-16: 27.0 (county); 5.6 (state)
> Inpatient beds occupied by COVID-19 patients: 8.4% (county); 2.3% (state)
> County population: 76,473
> County seat: Keene
[in-text-ad-2]

New Jersey: Cumberland County
> New COVID hospital admissions per 100,000 week Sep 10-16: 8.0 (county); 5.0 (state)
> Inpatient beds occupied by COVID-19 patients: 2.5% (county); 3.1% (state)
> County population: 154,921
> County seat: Bridgeton

New Mexico: San Juan County
> New COVID hospital admissions per 100,000 week Sep 10-16: 4.9 (county); 2.1 (state)
> Inpatient beds occupied by COVID-19 patients: 1.8% (county); 1.9% (state)
> County population: 122,912
> County seat: Aztec
[in-text-ad]
New York: Clinton County
> New COVID hospital admissions per 100,000 week Sep 10-16: 10.8 (county); 7.6 (state)
> Inpatient beds occupied by COVID-19 patients: 3.9% (county); 4.0% (state)
> County population: 80,095
> County seat: Plattsburgh
[recirclink id=1314987]

North Carolina: Pitt County
> New COVID hospital admissions per 100,000 week Sep 10-16: 12.6 (county); 5.8 (state)
> Inpatient beds occupied by COVID-19 patients: 4.6% (county); 4.0% (state)
> County population: 170,600
> County seat: Greenville

North Dakota: Stark County
> New COVID hospital admissions per 100,000 week Sep 10-16: 7.8 (county); 3.7 (state)
> Inpatient beds occupied by COVID-19 patients: 0.8% (county); 1.3% (state)
> County population: 32,710
> County seat: Dickinson
[in-text-ad-2]

Ohio: Washington County
> New COVID hospital admissions per 100,000 week Sep 10-16: 13.9 (county); 5.6 (state)
> Inpatient beds occupied by COVID-19 patients: 2.2% (county); 2.4% (state)
> County population: 59,942
> County seat: Marietta

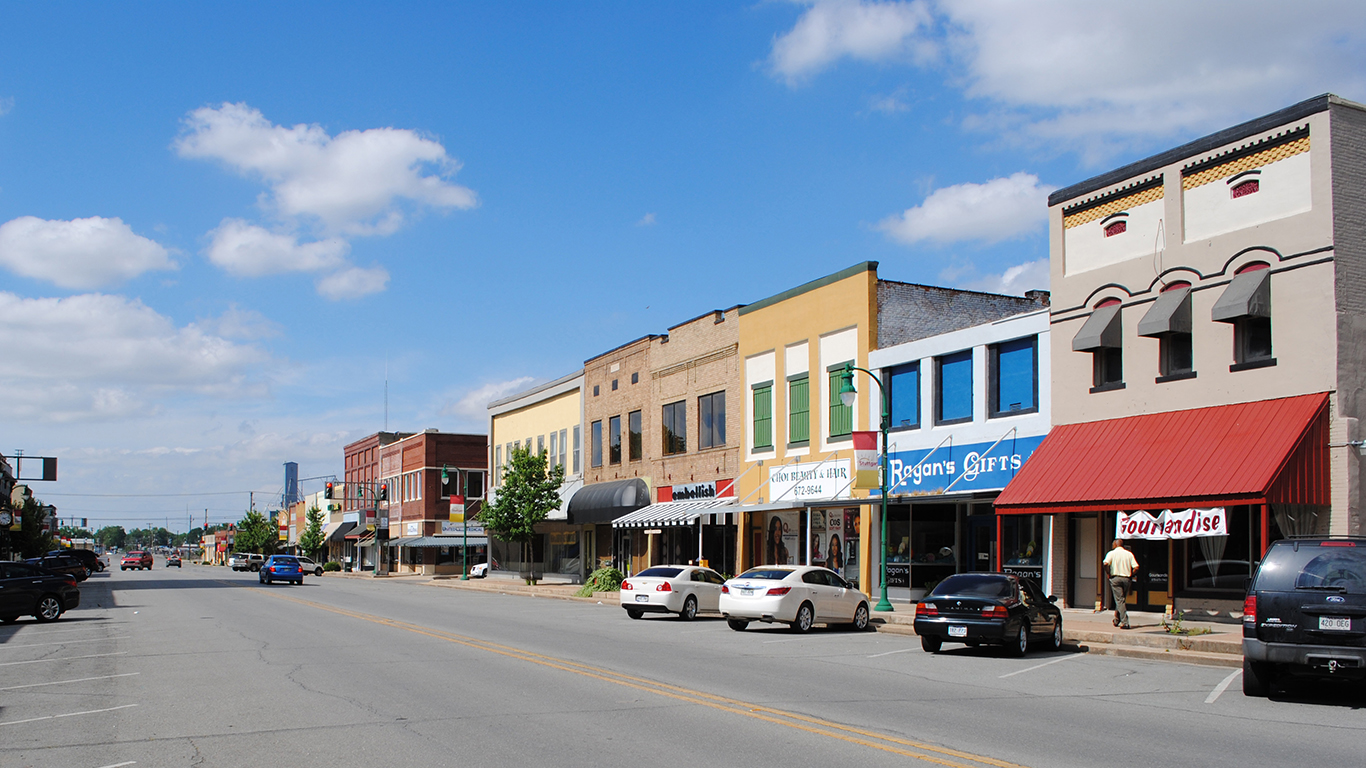
Oklahoma: Pontotoc County
> New COVID hospital admissions per 100,000 week Sep 10-16: 17.2 (county); 4.7 (state)
> Inpatient beds occupied by COVID-19 patients: 2.4% (county); 2.6% (state)
> County population: 38,102
> County seat: Ada
[in-text-ad]

Oregon: Coos County
> New COVID hospital admissions per 100,000 week Sep 10-16: 9.5 (county); 5.8 (state)
> Inpatient beds occupied by COVID-19 patients: 1.7% (county); 4.2% (state)
> County population: 64,619
> County seat: Coquille
[recirclink id=1315338]

Pennsylvania: Cambria County
> New COVID hospital admissions per 100,000 week Sep 10-16: 11.0 (county); 4.9 (state)
> Inpatient beds occupied by COVID-19 patients: 1.6% (county); 2.3% (state)
> County population: 134,048
> County seat: Ebensburg

Rhode Island: Newport County
> New COVID hospital admissions per 100,000 week Sep 10-16: 6.2 (county); 4.3 (state)
> Inpatient beds occupied by COVID-19 patients: 3.4% (county); 3.3% (state)
> County population: 85,525
> County seat: Newport
[in-text-ad-2]

South Carolina: Horry County
> New COVID hospital admissions per 100,000 week Sep 10-16: 11.5 (county); 7.0 (state)
> Inpatient beds occupied by COVID-19 patients: 3.7% (county); 4.0% (state)
> County population: 344,865
> County seat: Conway

South Dakota: Beadle County
> New COVID hospital admissions per 100,000 week Sep 10-16: 12.0 (county); 5.2 (state)
> Inpatient beds occupied by COVID-19 patients: 2.3% (county); 3.0% (state)
> County population: 18,959
> County seat: Huron
[in-text-ad]

Tennessee: Washington County
> New COVID hospital admissions per 100,000 week Sep 10-16: 18.7 (county); 5.3 (state)
> Inpatient beds occupied by COVID-19 patients: 3.9% (county); 3.0% (state)
> County population: 132,067
> County seat: Jonesborough
[recirclink id=1125679]

Texas: Navarro County
> New COVID hospital admissions per 100,000 week Sep 10-16: 24.3 (county); 6.4 (state)
> Inpatient beds occupied by COVID-19 patients: 10.4% (county); 3.1% (state)
> County population: 51,908
> County seat: Corsicana

Utah: Iron County
> New COVID hospital admissions per 100,000 week Sep 10-16: 6.5 (county); 4.2 (state)
> Inpatient beds occupied by COVID-19 patients: 0.6% (county); 2.3% (state)
> County population: 55,839
> County seat: Parowan
[in-text-ad-2]

Vermont: Windham County
> New COVID hospital admissions per 100,000 week Sep 10-16: 27.0 (county); 4.2 (state)
> Inpatient beds occupied by COVID-19 patients: 8.4% (county); 2.7% (state)
> County population: 45,811
> County seat: Newfane

Virginia: Prince George County
> New COVID hospital admissions per 100,000 week Sep 10-16: 12.3 (county); 5.2 (state)
> Inpatient beds occupied by COVID-19 patients: 2.9% (county); 3.2% (state)
> County population: 42,170
> County seat: Prince George
[in-text-ad]

Washington: Whatcom County
> New COVID hospital admissions per 100,000 week Sep 10-16: 9.6 (county); 4.6 (state)
> Inpatient beds occupied by COVID-19 patients: 7.4% (county); 3.5% (state)
> County population: 224,533
> County seat: Bellingham
[recirclink id=1314987]

West Virginia: Logan County
> New COVID hospital admissions per 100,000 week Sep 10-16: 14.1 (county); 8.0 (state)
> Inpatient beds occupied by COVID-19 patients: 4.2% (county); 3.2% (state)
> County population: 32,786
> County seat: Logan

Wisconsin: Oneida County
> New COVID hospital admissions per 100,000 week Sep 10-16: 8.7 (county); 4.3 (state)
> Inpatient beds occupied by COVID-19 patients: 1.3% (county); 1.9% (state)
> County population: 37,468
> County seat: Rhinelander
[in-text-ad-2]

Wyoming: Goshen County
> New COVID hospital admissions per 100,000 week Sep 10-16: 11.5 (county); 4.3 (state)
> Inpatient beds occupied by COVID-19 patients: 0.9% (county); 2.8% (state)
> County population: 12,642
> County seat: Torrington
Methodology
To determine the counties where the COVID-19 surge is the worst in every state, 24/7 Tempo reviewed data on COVID-19 hospitalizations from the Centers for Disease Control and Prevention. Counties were ranked based on the number of new COVID-19 hospital admissions per 100,000 residents during the week of Sept. 10-16, 2023. Supplemental data on the percentage of staffed inpatient hospital beds occupied by confirmed COVID-19 patients over the same time period also came from the CDC. Data on total population is from the U.S. Census Bureau’s 2021 American Community Survey and are five-year estimates.
Contact [email protected] for any questions or corrections.