
More than 60 years have passed since President Lyndon Johnson declared war on poverty, and yet, poverty remains endemic in the United States. In any given year over the last three decades, anywhere from 31.6 million to 48.8 million Americans were living below the poverty line. Over that period, the annual U.S. poverty rate climbed as high as 15.9%, and never fell below 11.3%.
The effects of poverty extend far beyond economics. According to the latest Pulse Survey from the U.S. Census Bureau, 38% of American adults earning less than $25,000 reported feeling depressed or hopeless on most days, compared to 17% of all adults. Additionally, 27% of adults in the lowest income bracket reported not having enough to eat within the last week, three times the food insufficiency rate among all adults.
In most of the country, including Ohio, the U.S. Department of Health and Human Services sets the poverty line at an annual income of $15,060 for individuals and $31,200 for a family of four. In Ohio, 13.3% of the population live below these thresholds — and in many towns across the state, the poverty rate is far higher.
Using five-year estimates from the Census’ 2022 American Community Survey, 24/7 Wall St. identified the towns in Ohio with the highest poverty rates. We considered all places — including cities, towns, and unincorporated communities — with populations between 5,000 and 50,000. Because the presence of colleges and universities can distort economic realities in a given area, places where 20% or more of the population are enrolled in a post-secondary institution were excluded from analysis.
Among the 35 places on this list, poverty rates range from 20.7% to nearly 40%, and in each of these places, the typical household earns less than the statewide median household income of $66,990.
Widespread financial hardship in these areas is partially attributable to a lack of economic opportunity. In most places on this list, the five-year average unemployment rate is higher than the comparable 5.0% jobless rate across Ohio.
Incomes and job security tend to rise with educational attainment. According to the Bureau of Labor Statistics, the typical worker with a bachelor’s degree earns 66% more than those with no more than a high school diploma. Additionally, workers with only a high school education are far more likely to be unemployed than college graduates. In nearly every town on this list, the share of adults with a bachelor’s degree is below the 30.4% statewide bachelor’s degree attainment rate.
Why It Matters

Source: addkm / Shutterstock.com
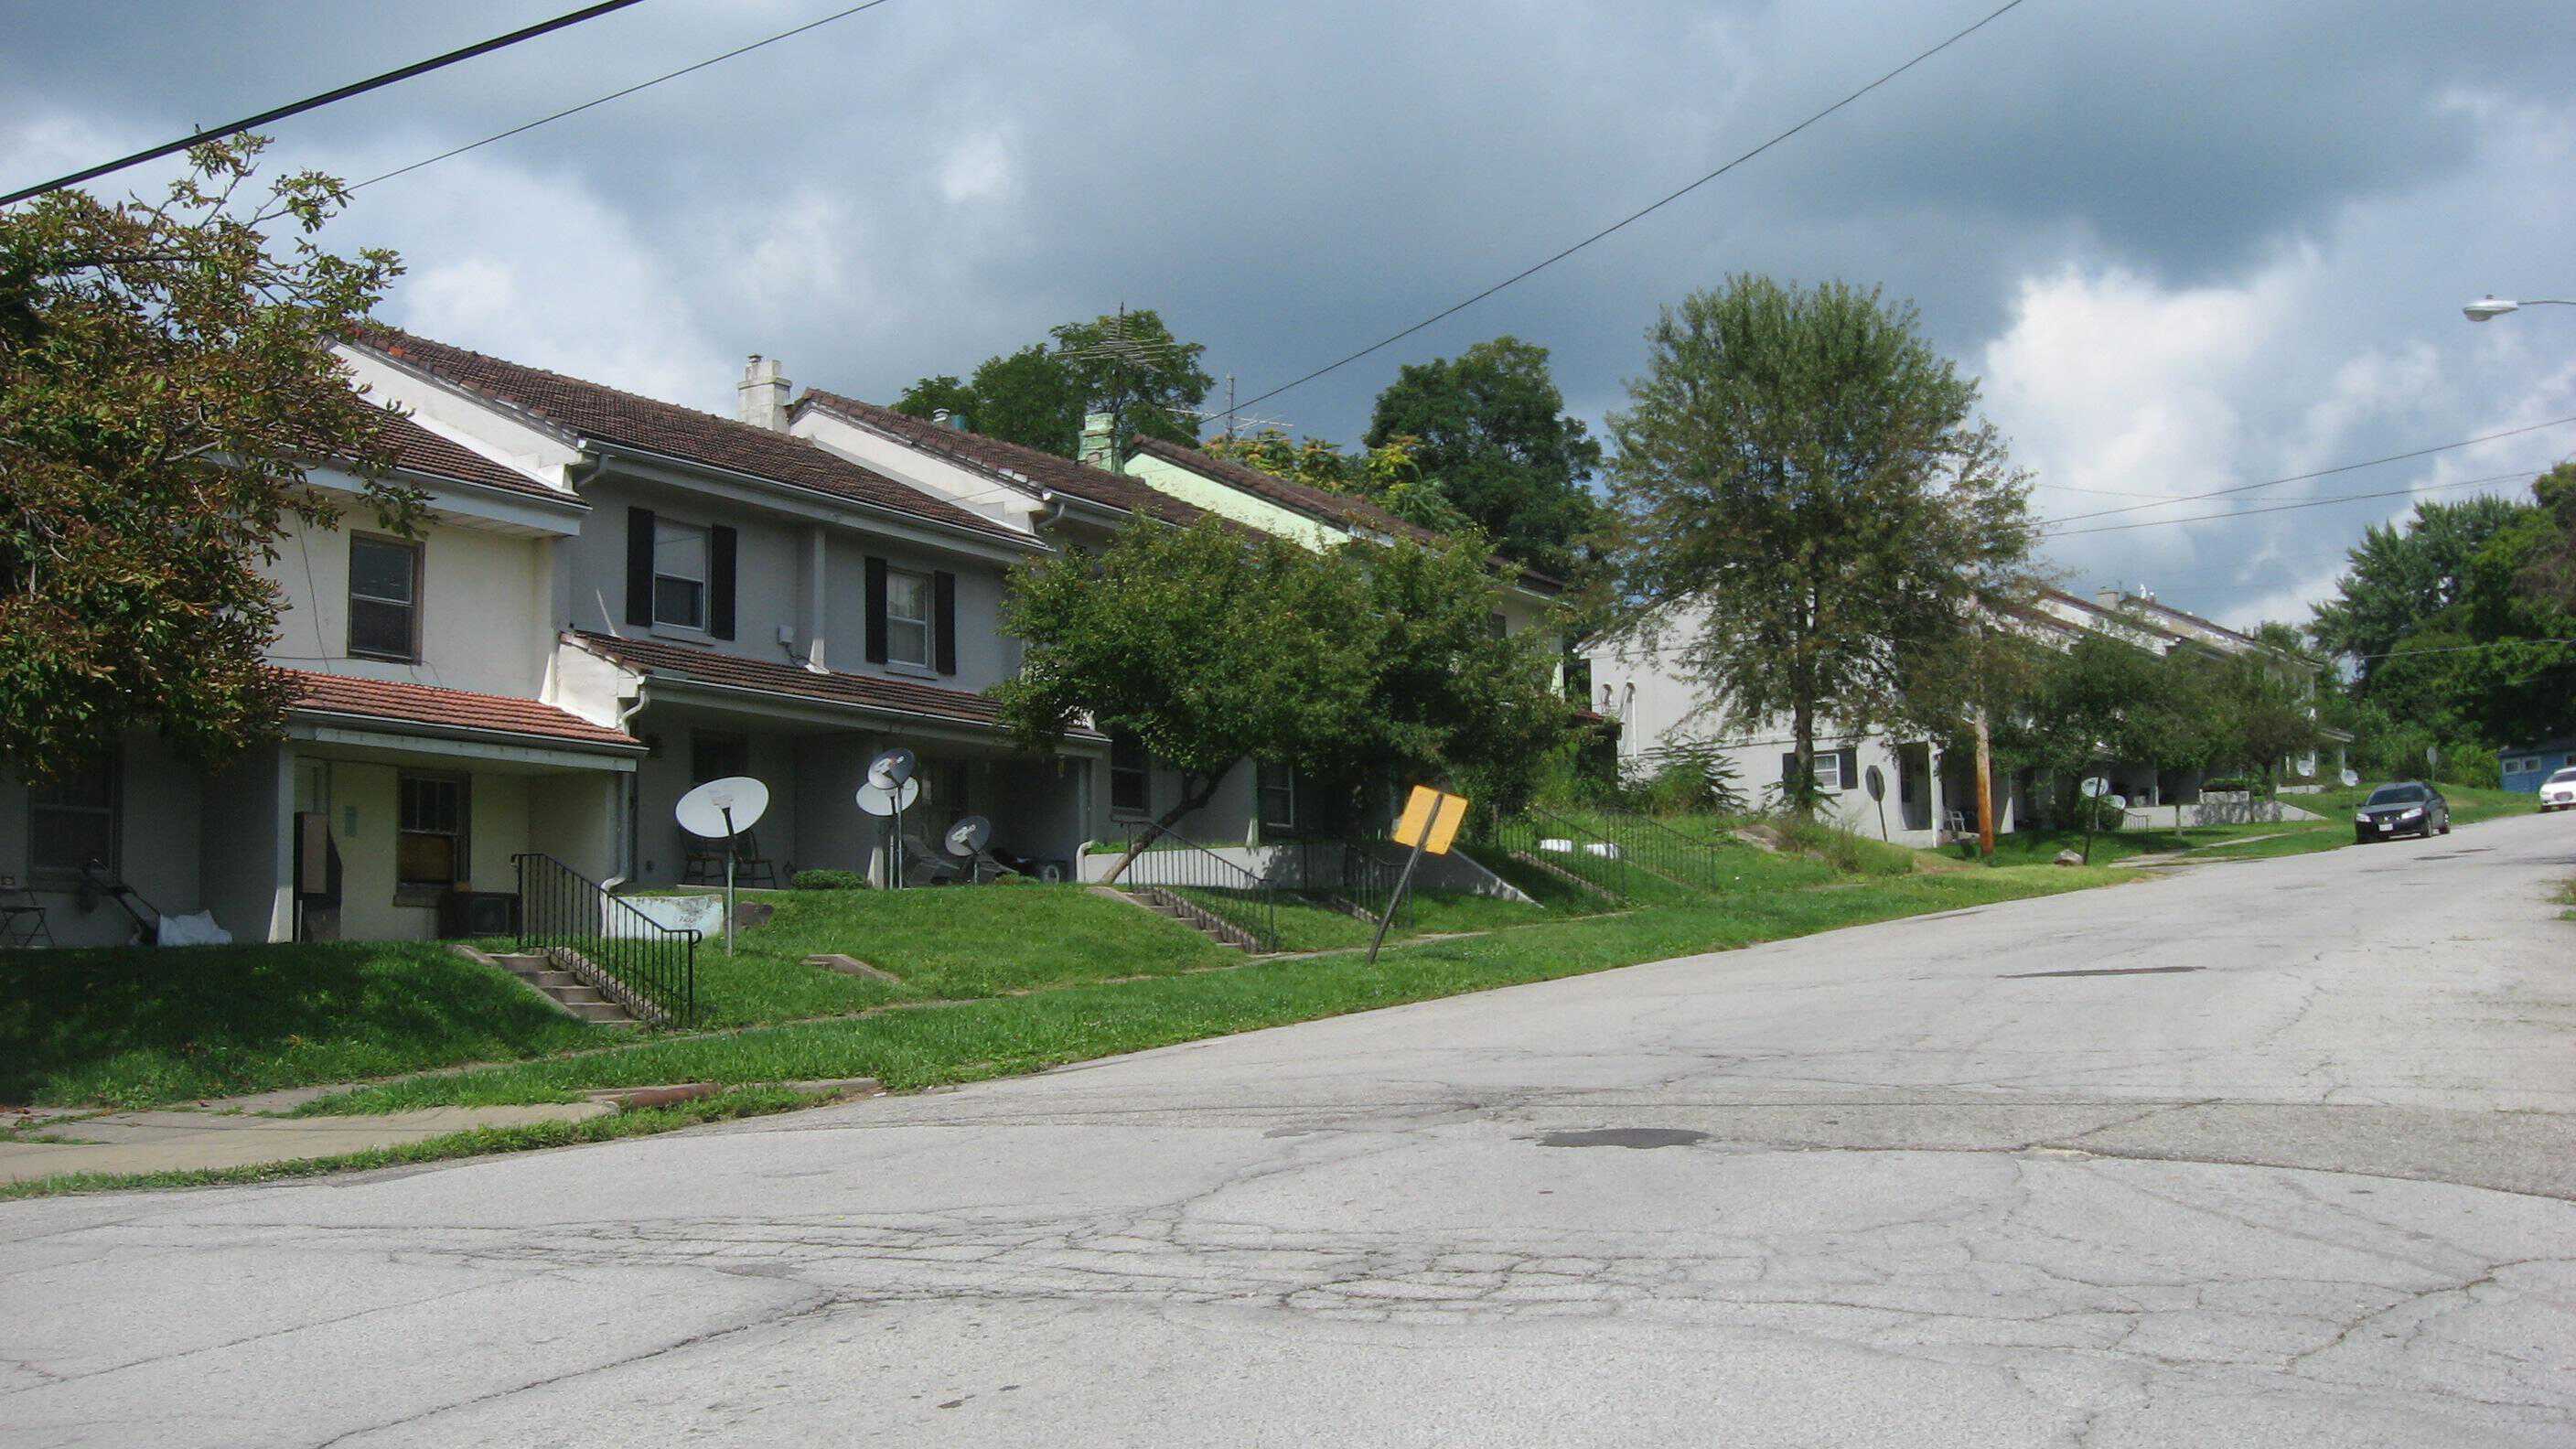
The United States is, in many ways, the center of gravity of the global economy. The U.S. dollar has been the world’s leading reserve currency since the end of World War II, and American gross domestic product accounts for over a quarter of economic activity worldwide. Despite these advantages, more than one in every 10 Americans have been living below the poverty line for decades. For those facing serious financial hardship, the effects are far reaching. Poverty can negatively impact mental health, social relationships, and life expectancy.
35. Warrensville Heights
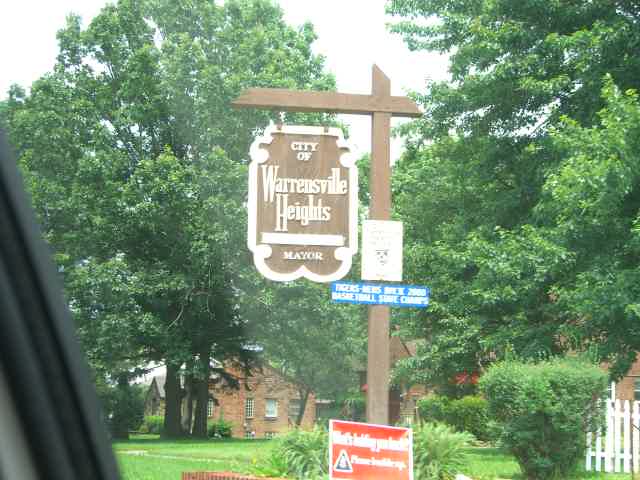
Source: Public Domain / Wikimedia Commons
- Poverty rate: 20.7%
- Median household income: $43,848
- 5-yr. avg. unemployment rate: 10.2%
- Adults with a bachelor’s degree or higher: 19.6%
- Population: 13,659
34. Port Clinton
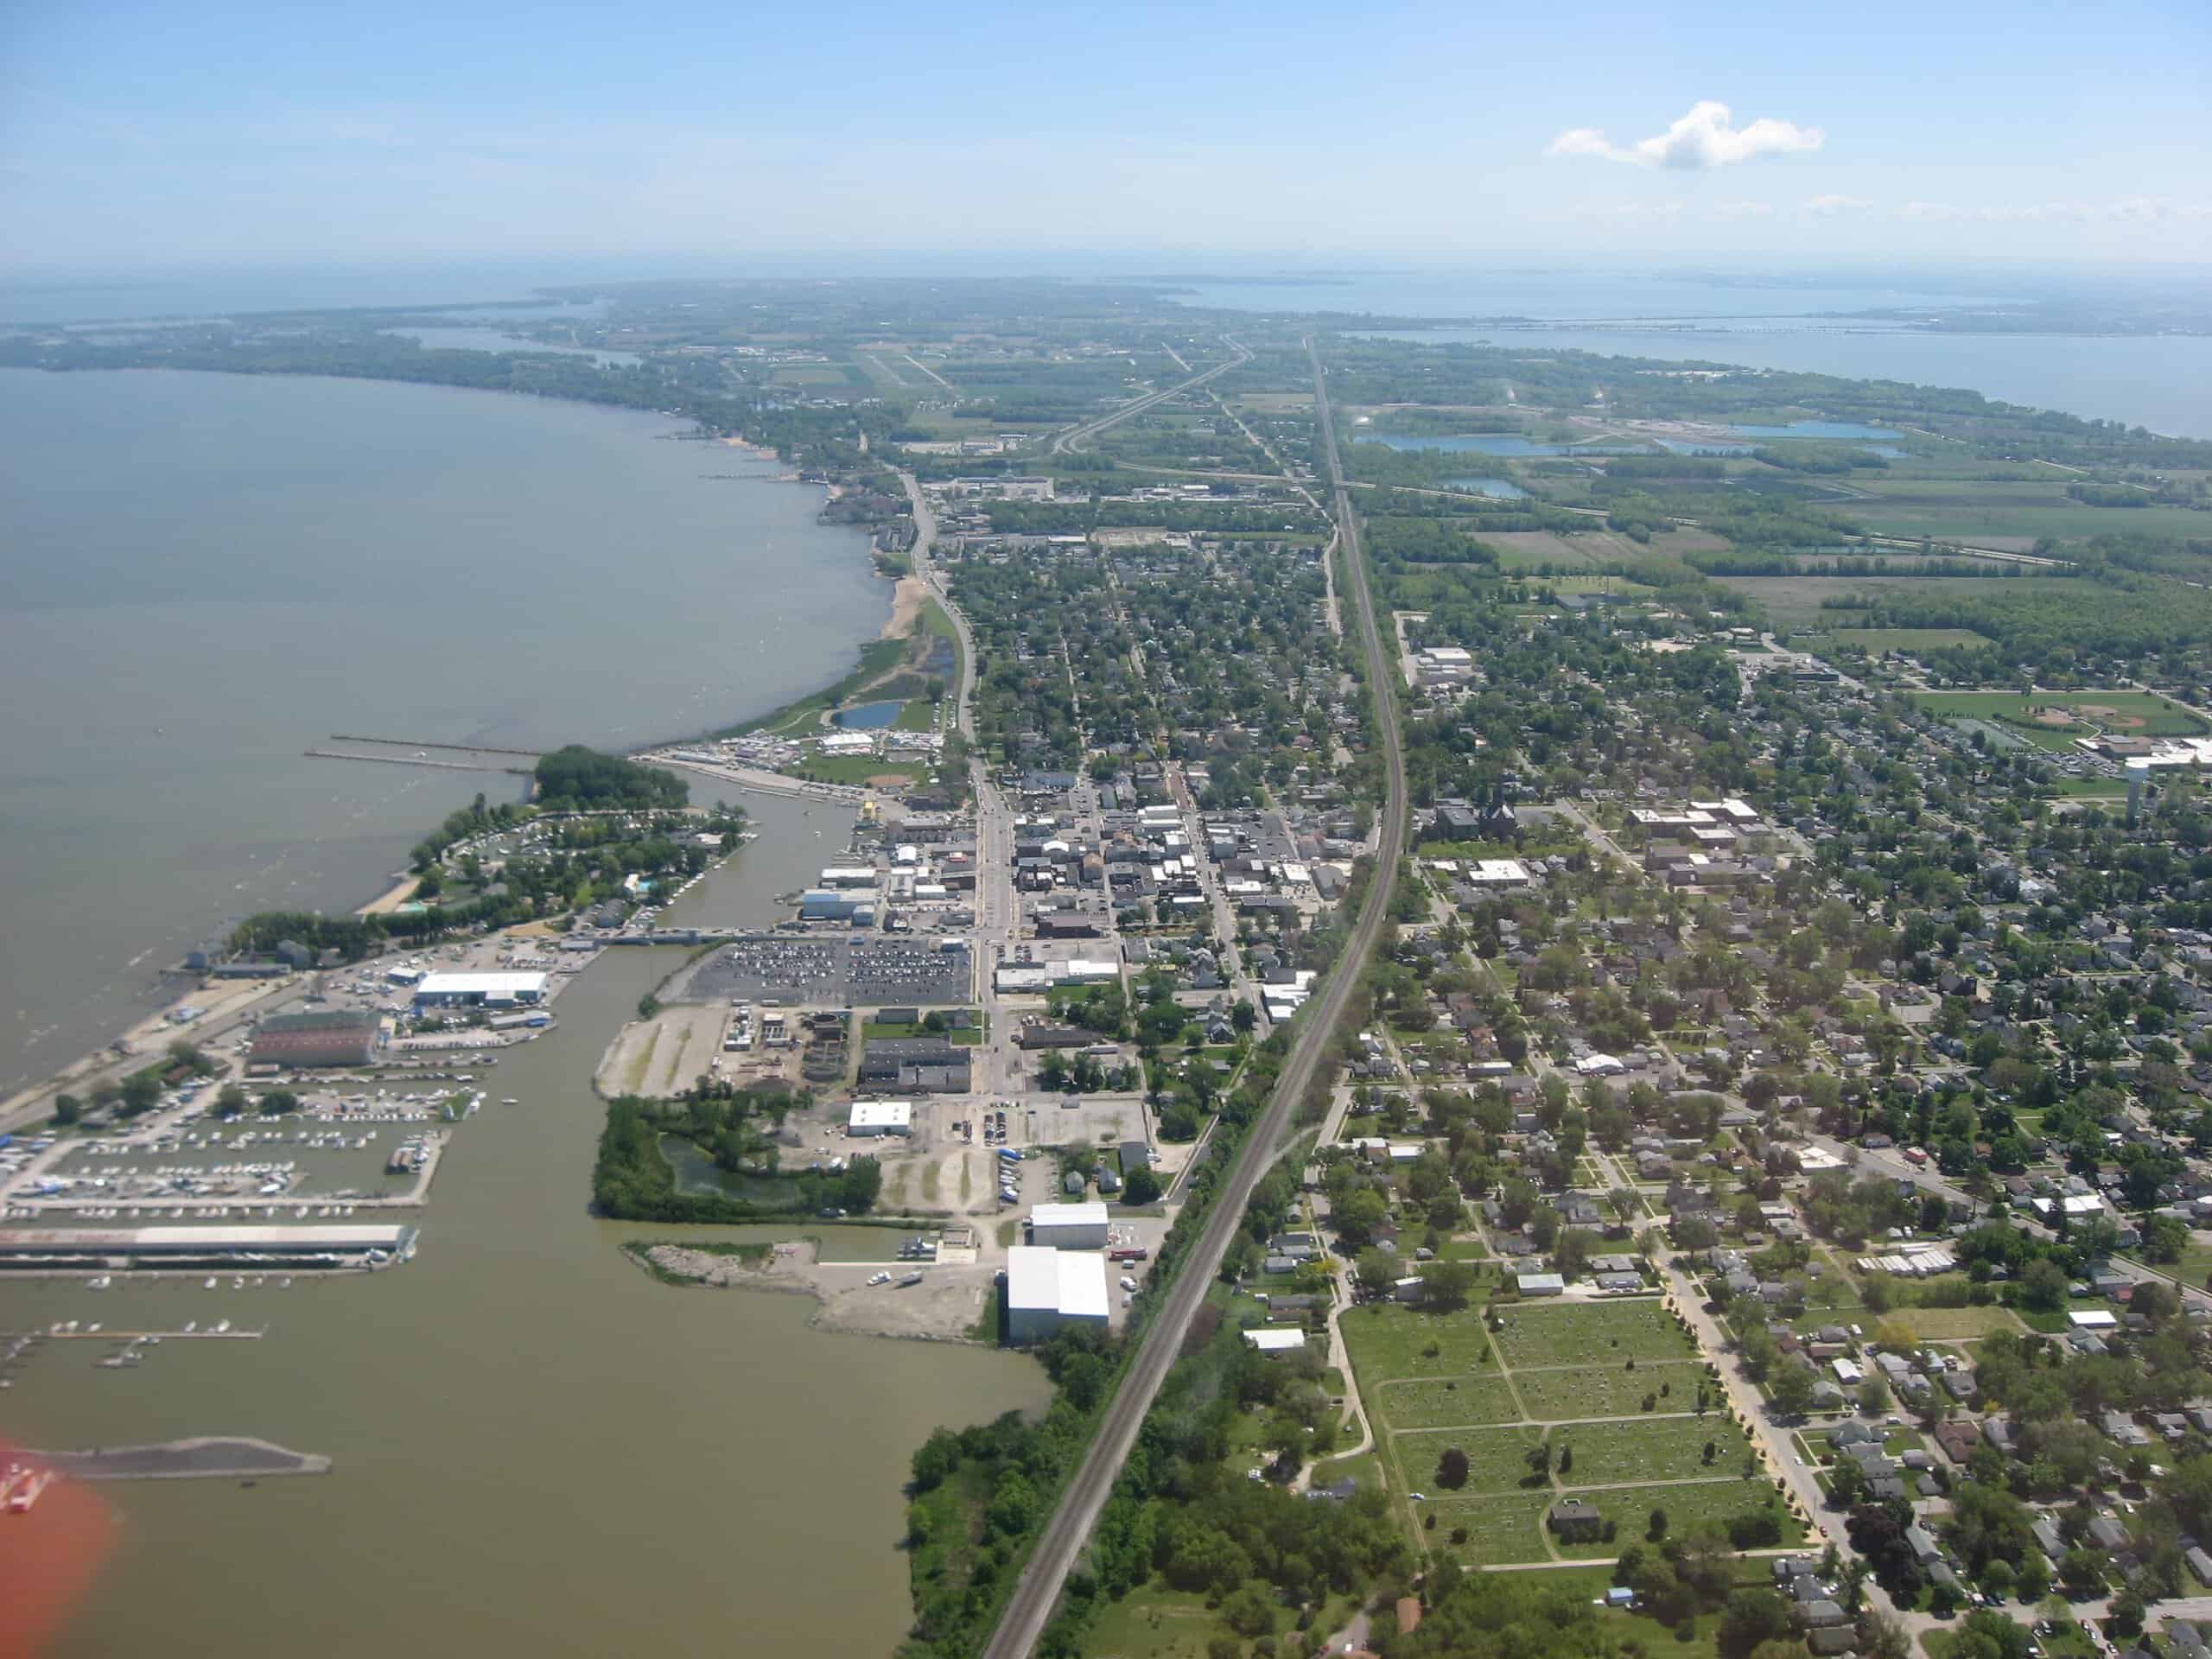
Source: Public Domain / Wikimedia Commons
- Poverty rate: 20.7%
- Median household income: $55,534
- 5-yr. avg. unemployment rate: 5.2%
- Adults with a bachelor’s degree or higher: 18.0%
- Population: 6,024
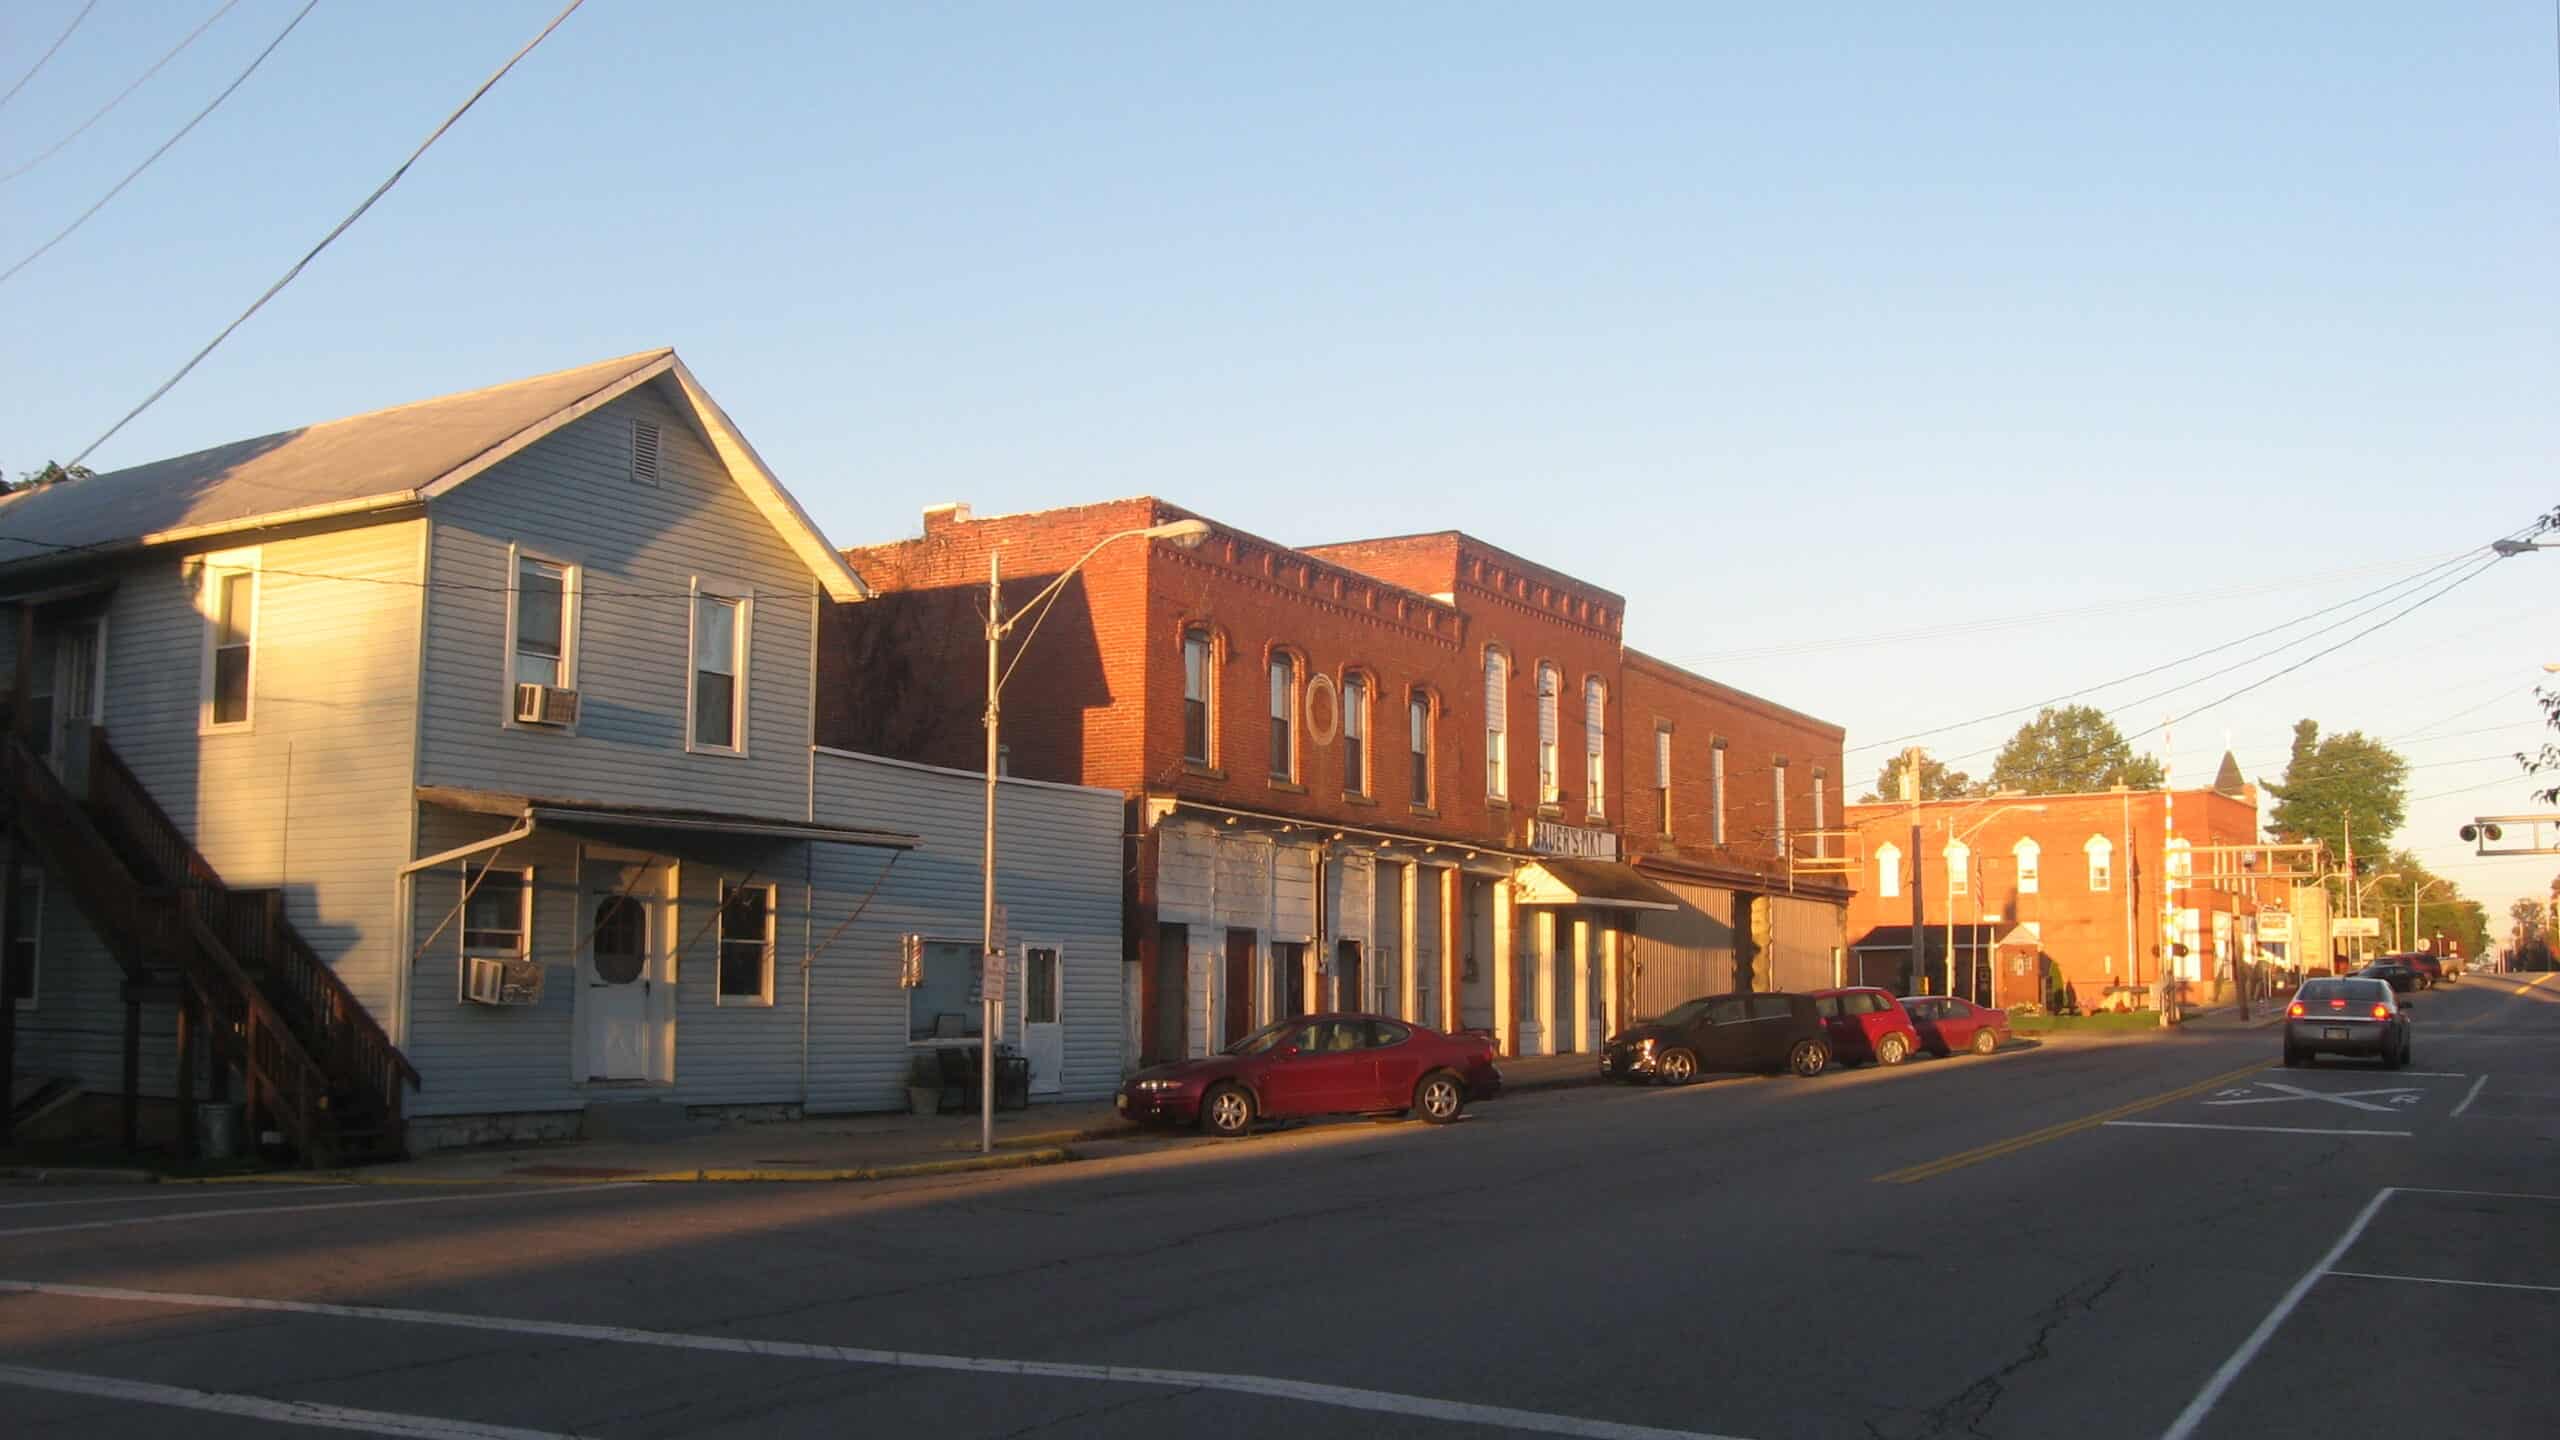
33. Fostoria
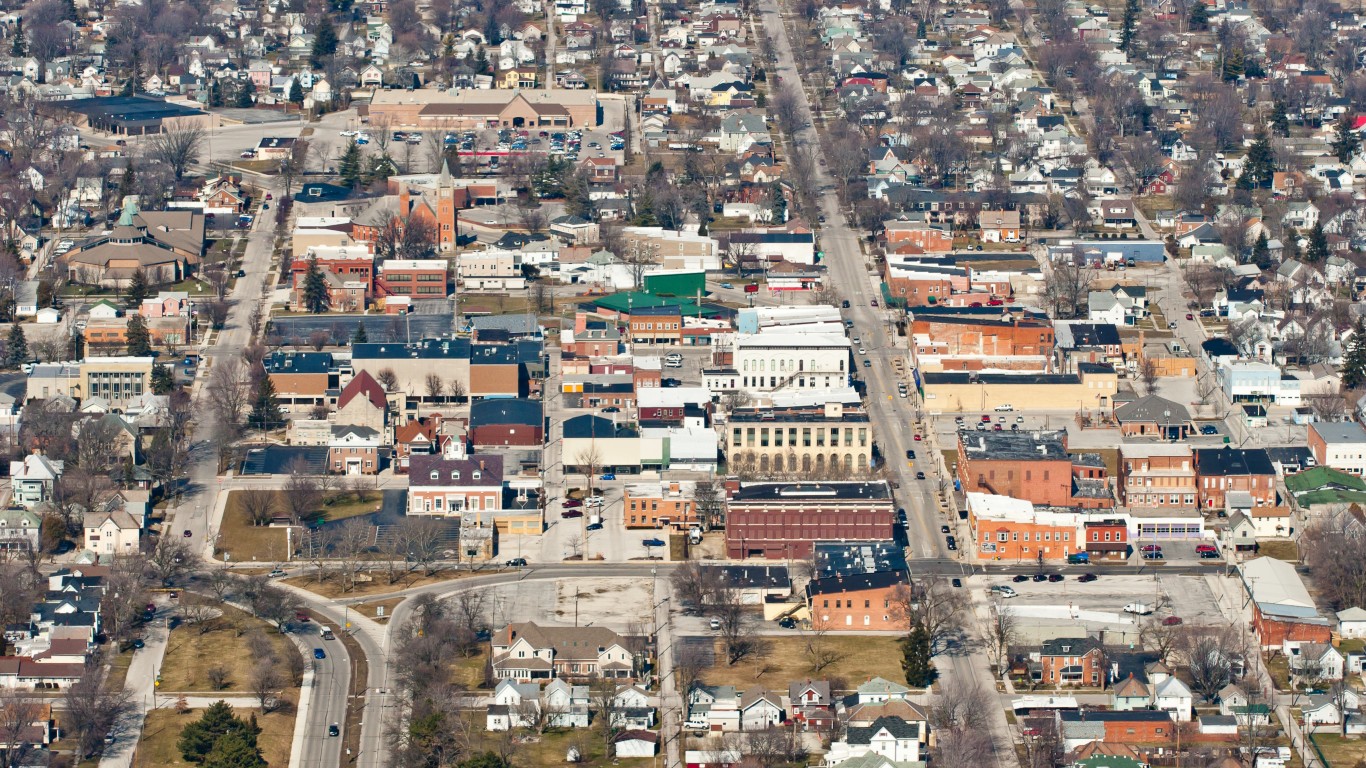
Source: BrandonTownley / iStock via Getty Images
- Poverty rate: 21.0%
- Median household income: $53,145
- 5-yr. avg. unemployment rate: 5.8%
- Adults with a bachelor’s degree or higher: 11.2%
- Population: 12,904
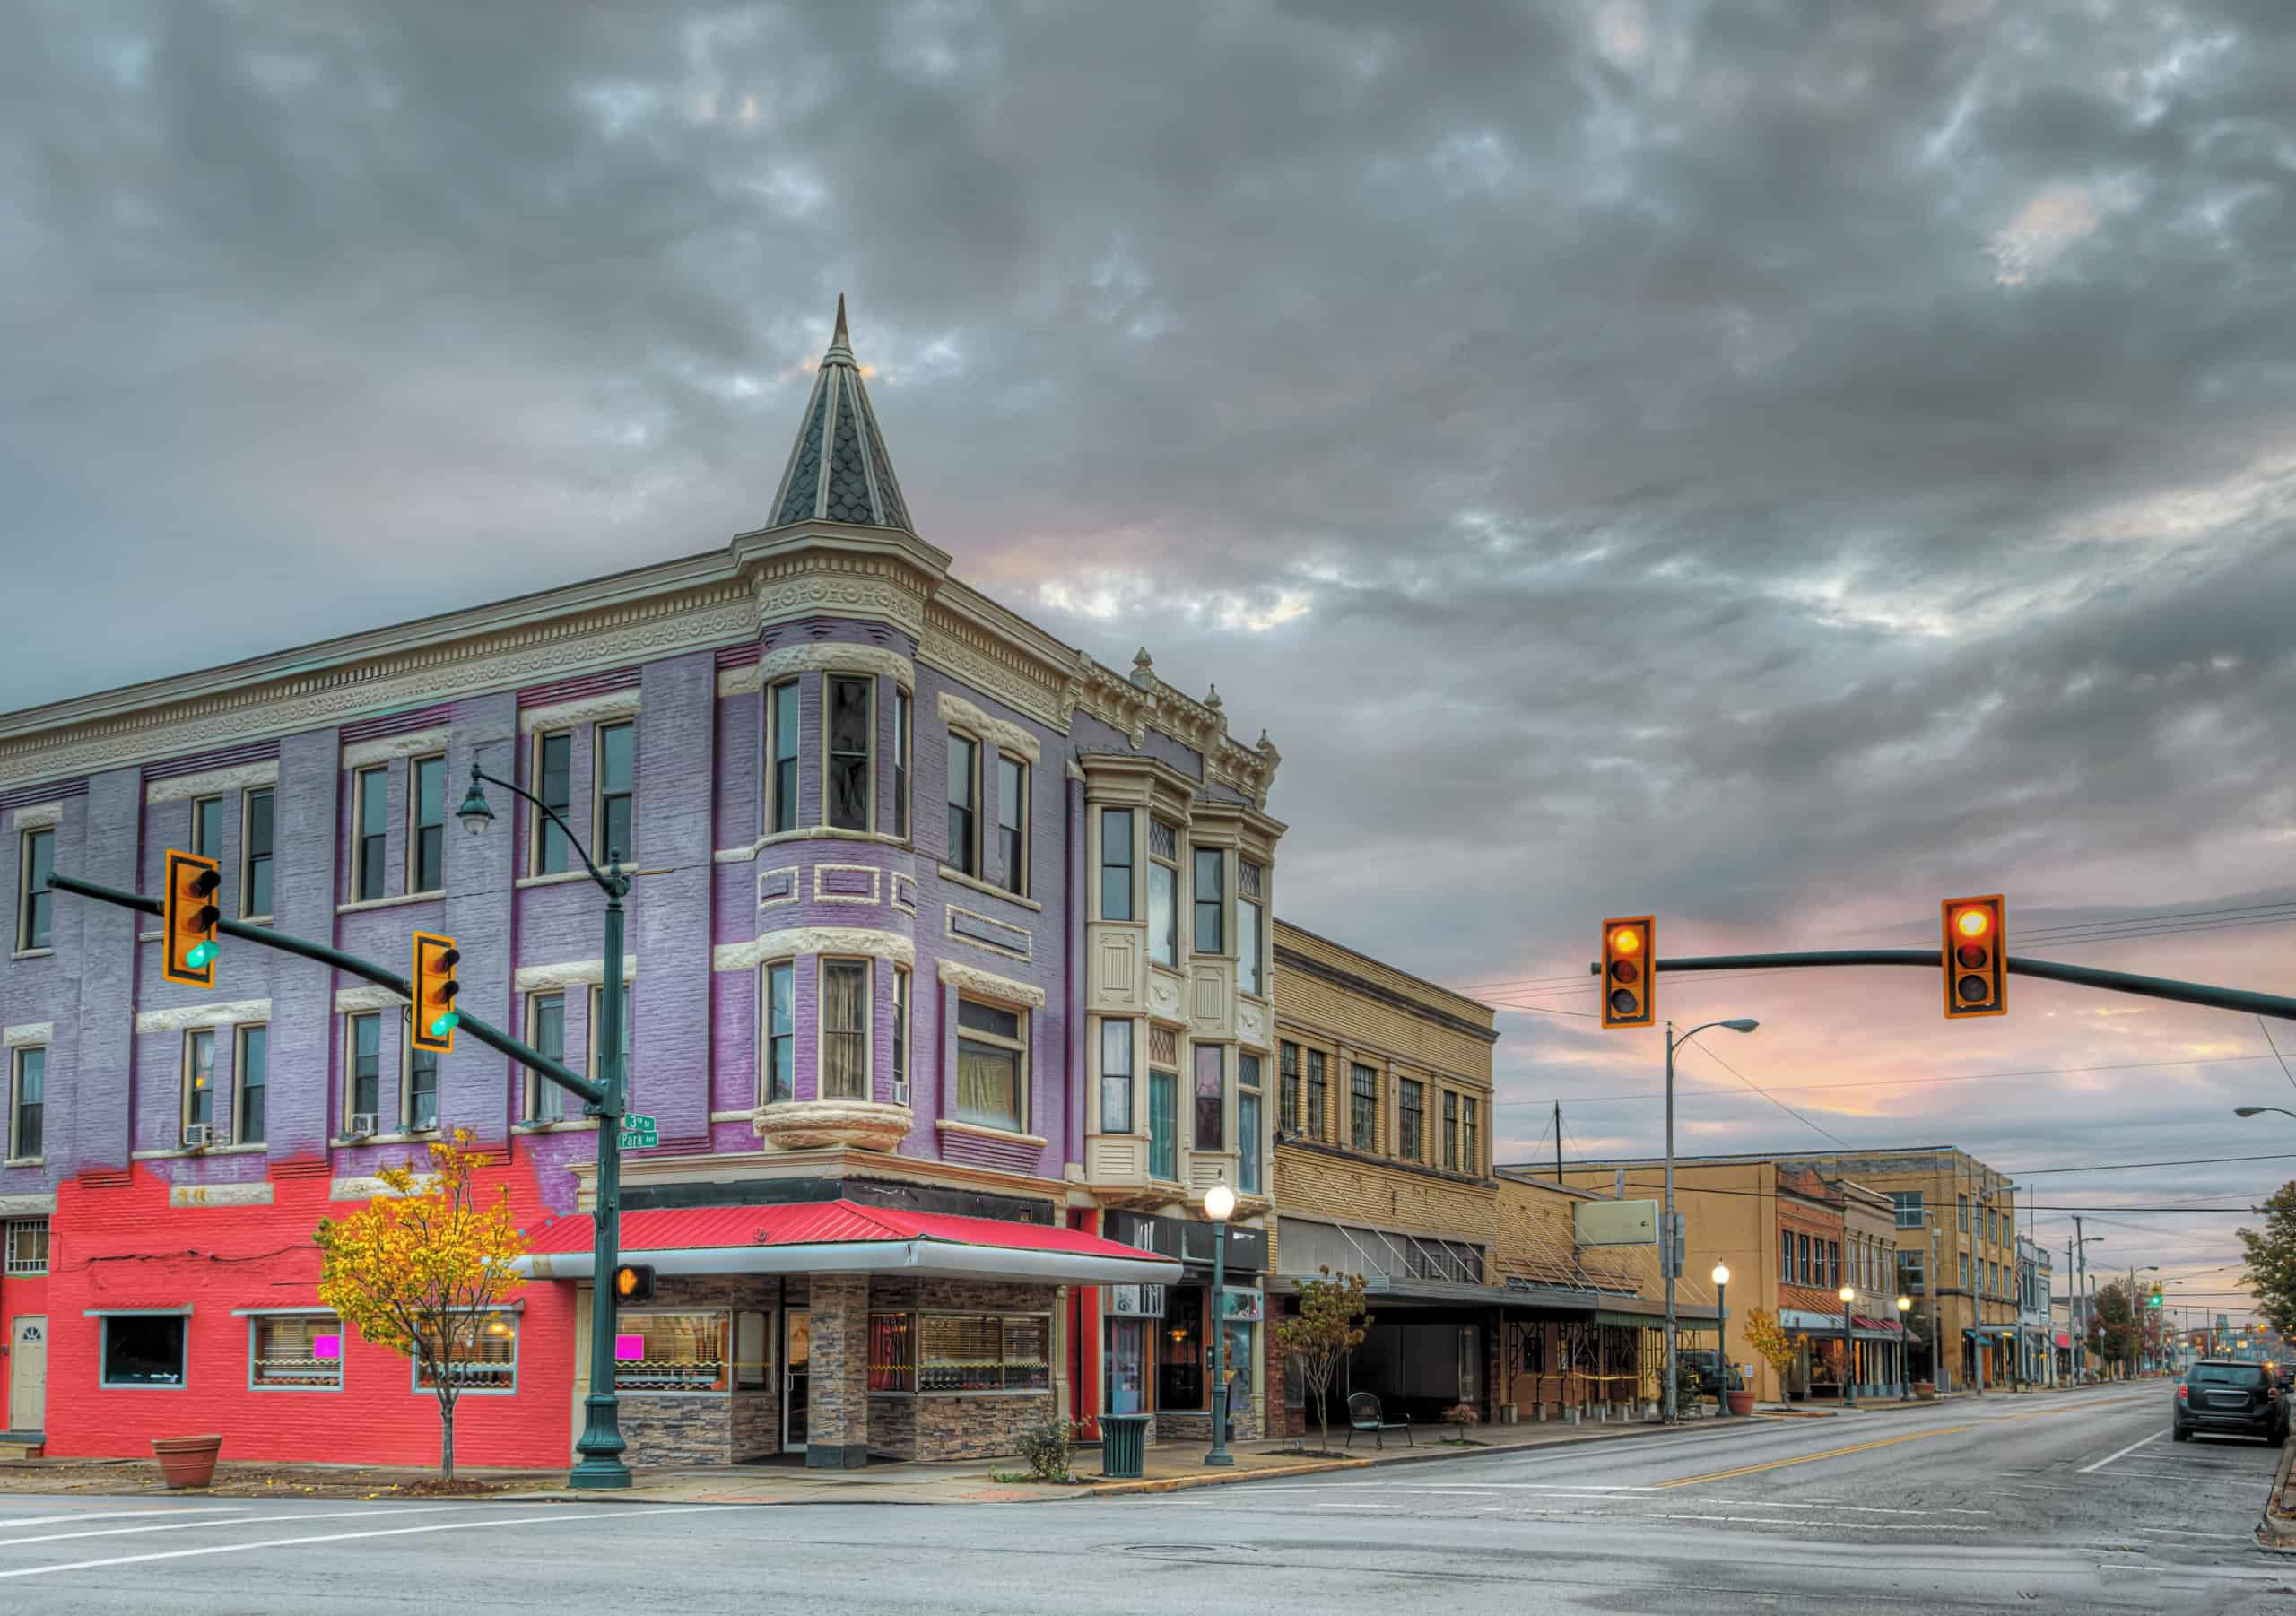
32. Wilmington
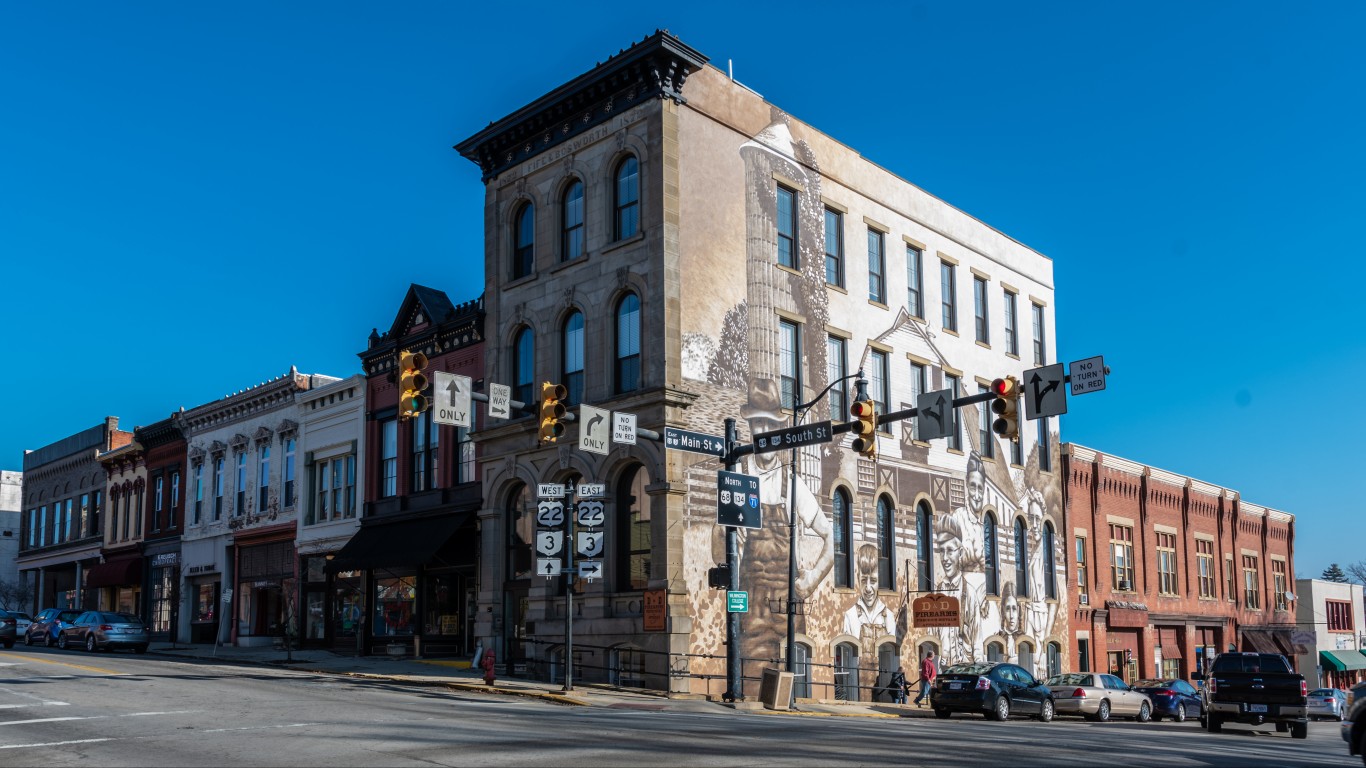
Source: Jacqueline Nix / iStock Editorial via Getty Images
- Poverty rate: 21.1%
- Median household income: $48,407
- 5-yr. avg. unemployment rate: 5.0%
- Adults with a bachelor’s degree or higher: 22.2%
- Population: 12,669
31. New Carlisle
Source: loganrickert / Wikimedia Commons
- Poverty rate: 21.4%
- Median household income: $56,744
- 5-yr. avg. unemployment rate: 17.1%
- Adults with a bachelor’s degree or higher: 13.4%
- Population: 5,579
30. Maple Heights

Source: Public Domain / Wikimedia Commons
- Poverty rate: 21.6%
- Median household income: $49,877
- 5-yr. avg. unemployment rate: 8.3%
- Adults with a bachelor’s degree or higher: 15.7%
- Population: 23,473
29. Marion

Source: Public Domain / Wikimedia Commons
- Poverty rate: 21.8%
- Median household income: $44,879
- 5-yr. avg. unemployment rate: 8.7%
- Adults with a bachelor’s degree or higher: 10.1%
- Population: 35,927
28. Garfield Heights

- Poverty rate: 22.0%
- Median household income: $49,864
- 5-yr. avg. unemployment rate: 9.8%
- Adults with a bachelor’s degree or higher: 15.0%
- Population: 29,497
27. Marietta
Source: ChrisBoswell / iStock via Getty Images
- Poverty rate: 22.0%
- Median household income: $44,401
- 5-yr. avg. unemployment rate: 5.6%
- Adults with a bachelor’s degree or higher: 30.0%
- Population: 13,366
26. Jackson

Source: Public Domain / Wikimedia Commons
- Poverty rate: 22.1%
- Median household income: $51,864
- 5-yr. avg. unemployment rate: 4.8%
- Adults with a bachelor’s degree or higher: 16.5%
- Population: 6,222
25. Wellston
Source: Wendy Van / iStock Editorial via Getty Images
- Poverty rate: 22.3%
- Median household income: $51,597
- 5-yr. avg. unemployment rate: 5.6%
- Adults with a bachelor’s degree or higher: 7.0%
- Population: 5,420
24. Uhrichsville
Source: Roseohioresident / Wikimedia Commons
- Poverty rate: 22.5%
- Median household income: $42,155
- 5-yr. avg. unemployment rate: 10.2%
- Adults with a bachelor’s degree or higher: 10.5%
- Population: 5,238
23. Alliance
Source: Sanfranman59 / Wikimedia Commons
- Poverty rate: 23.1%
- Median household income: $51,721
- 5-yr. avg. unemployment rate: 4.0%
- Adults with a bachelor’s degree or higher: 18.0%
- Population: 21,603
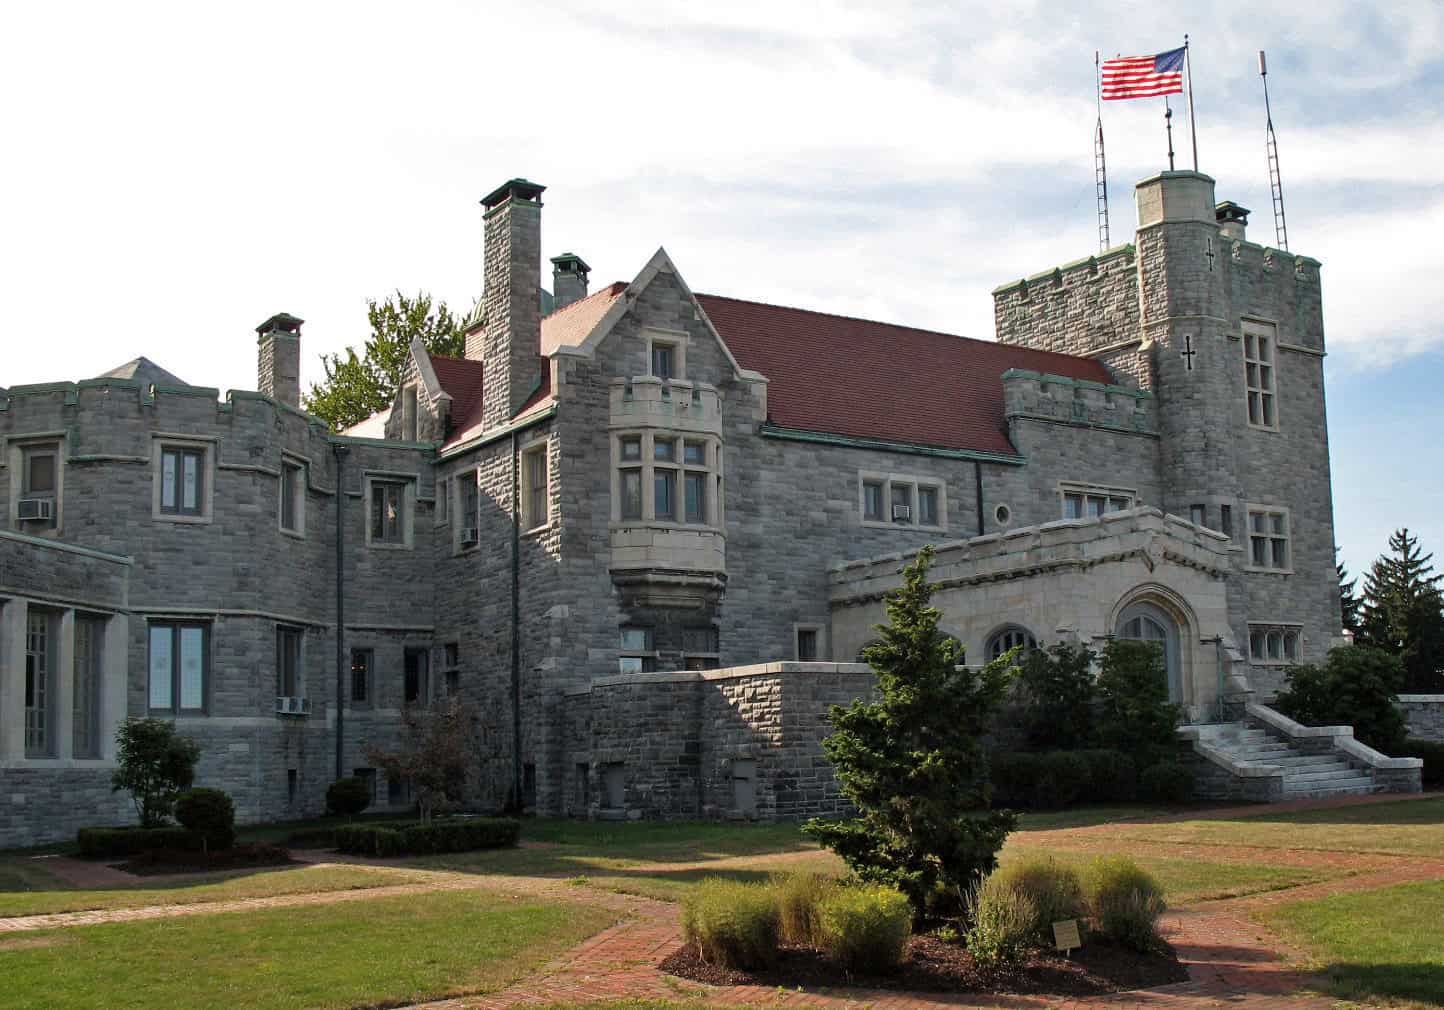
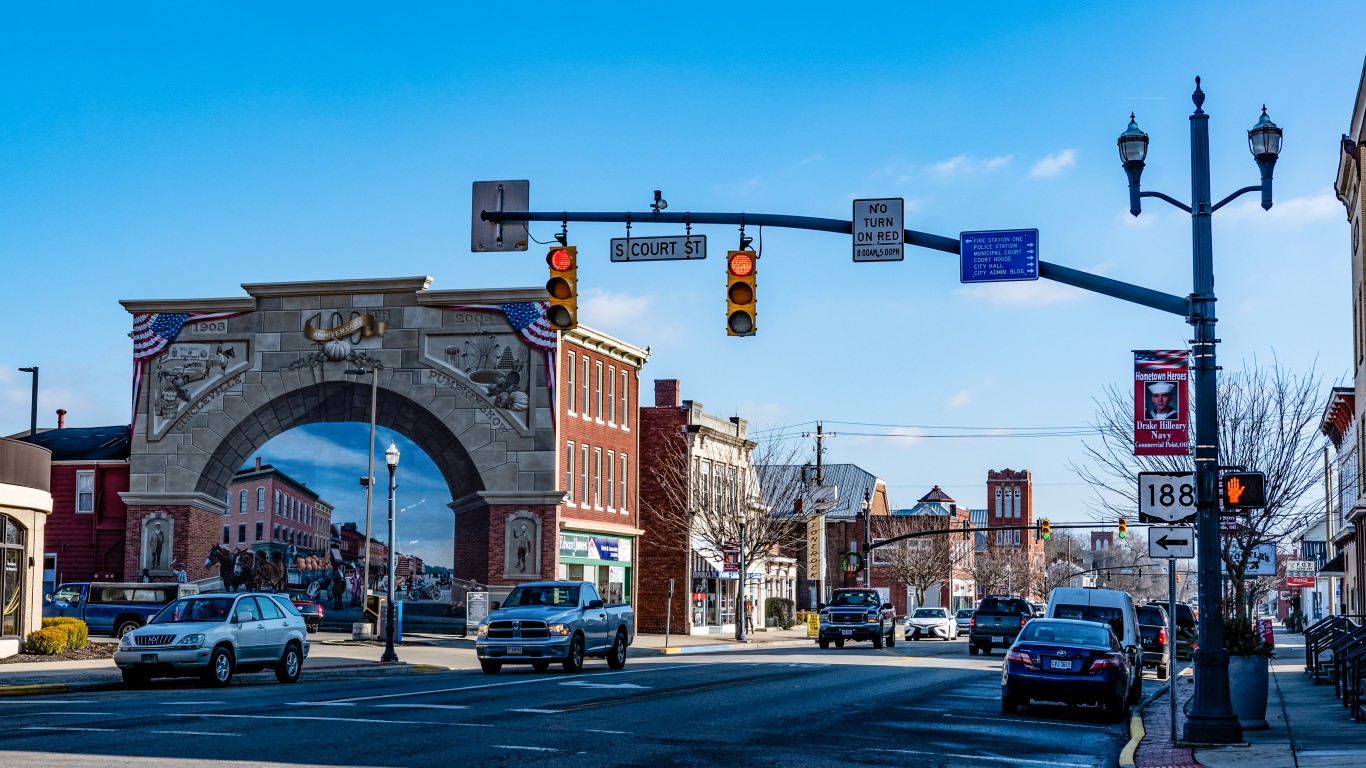
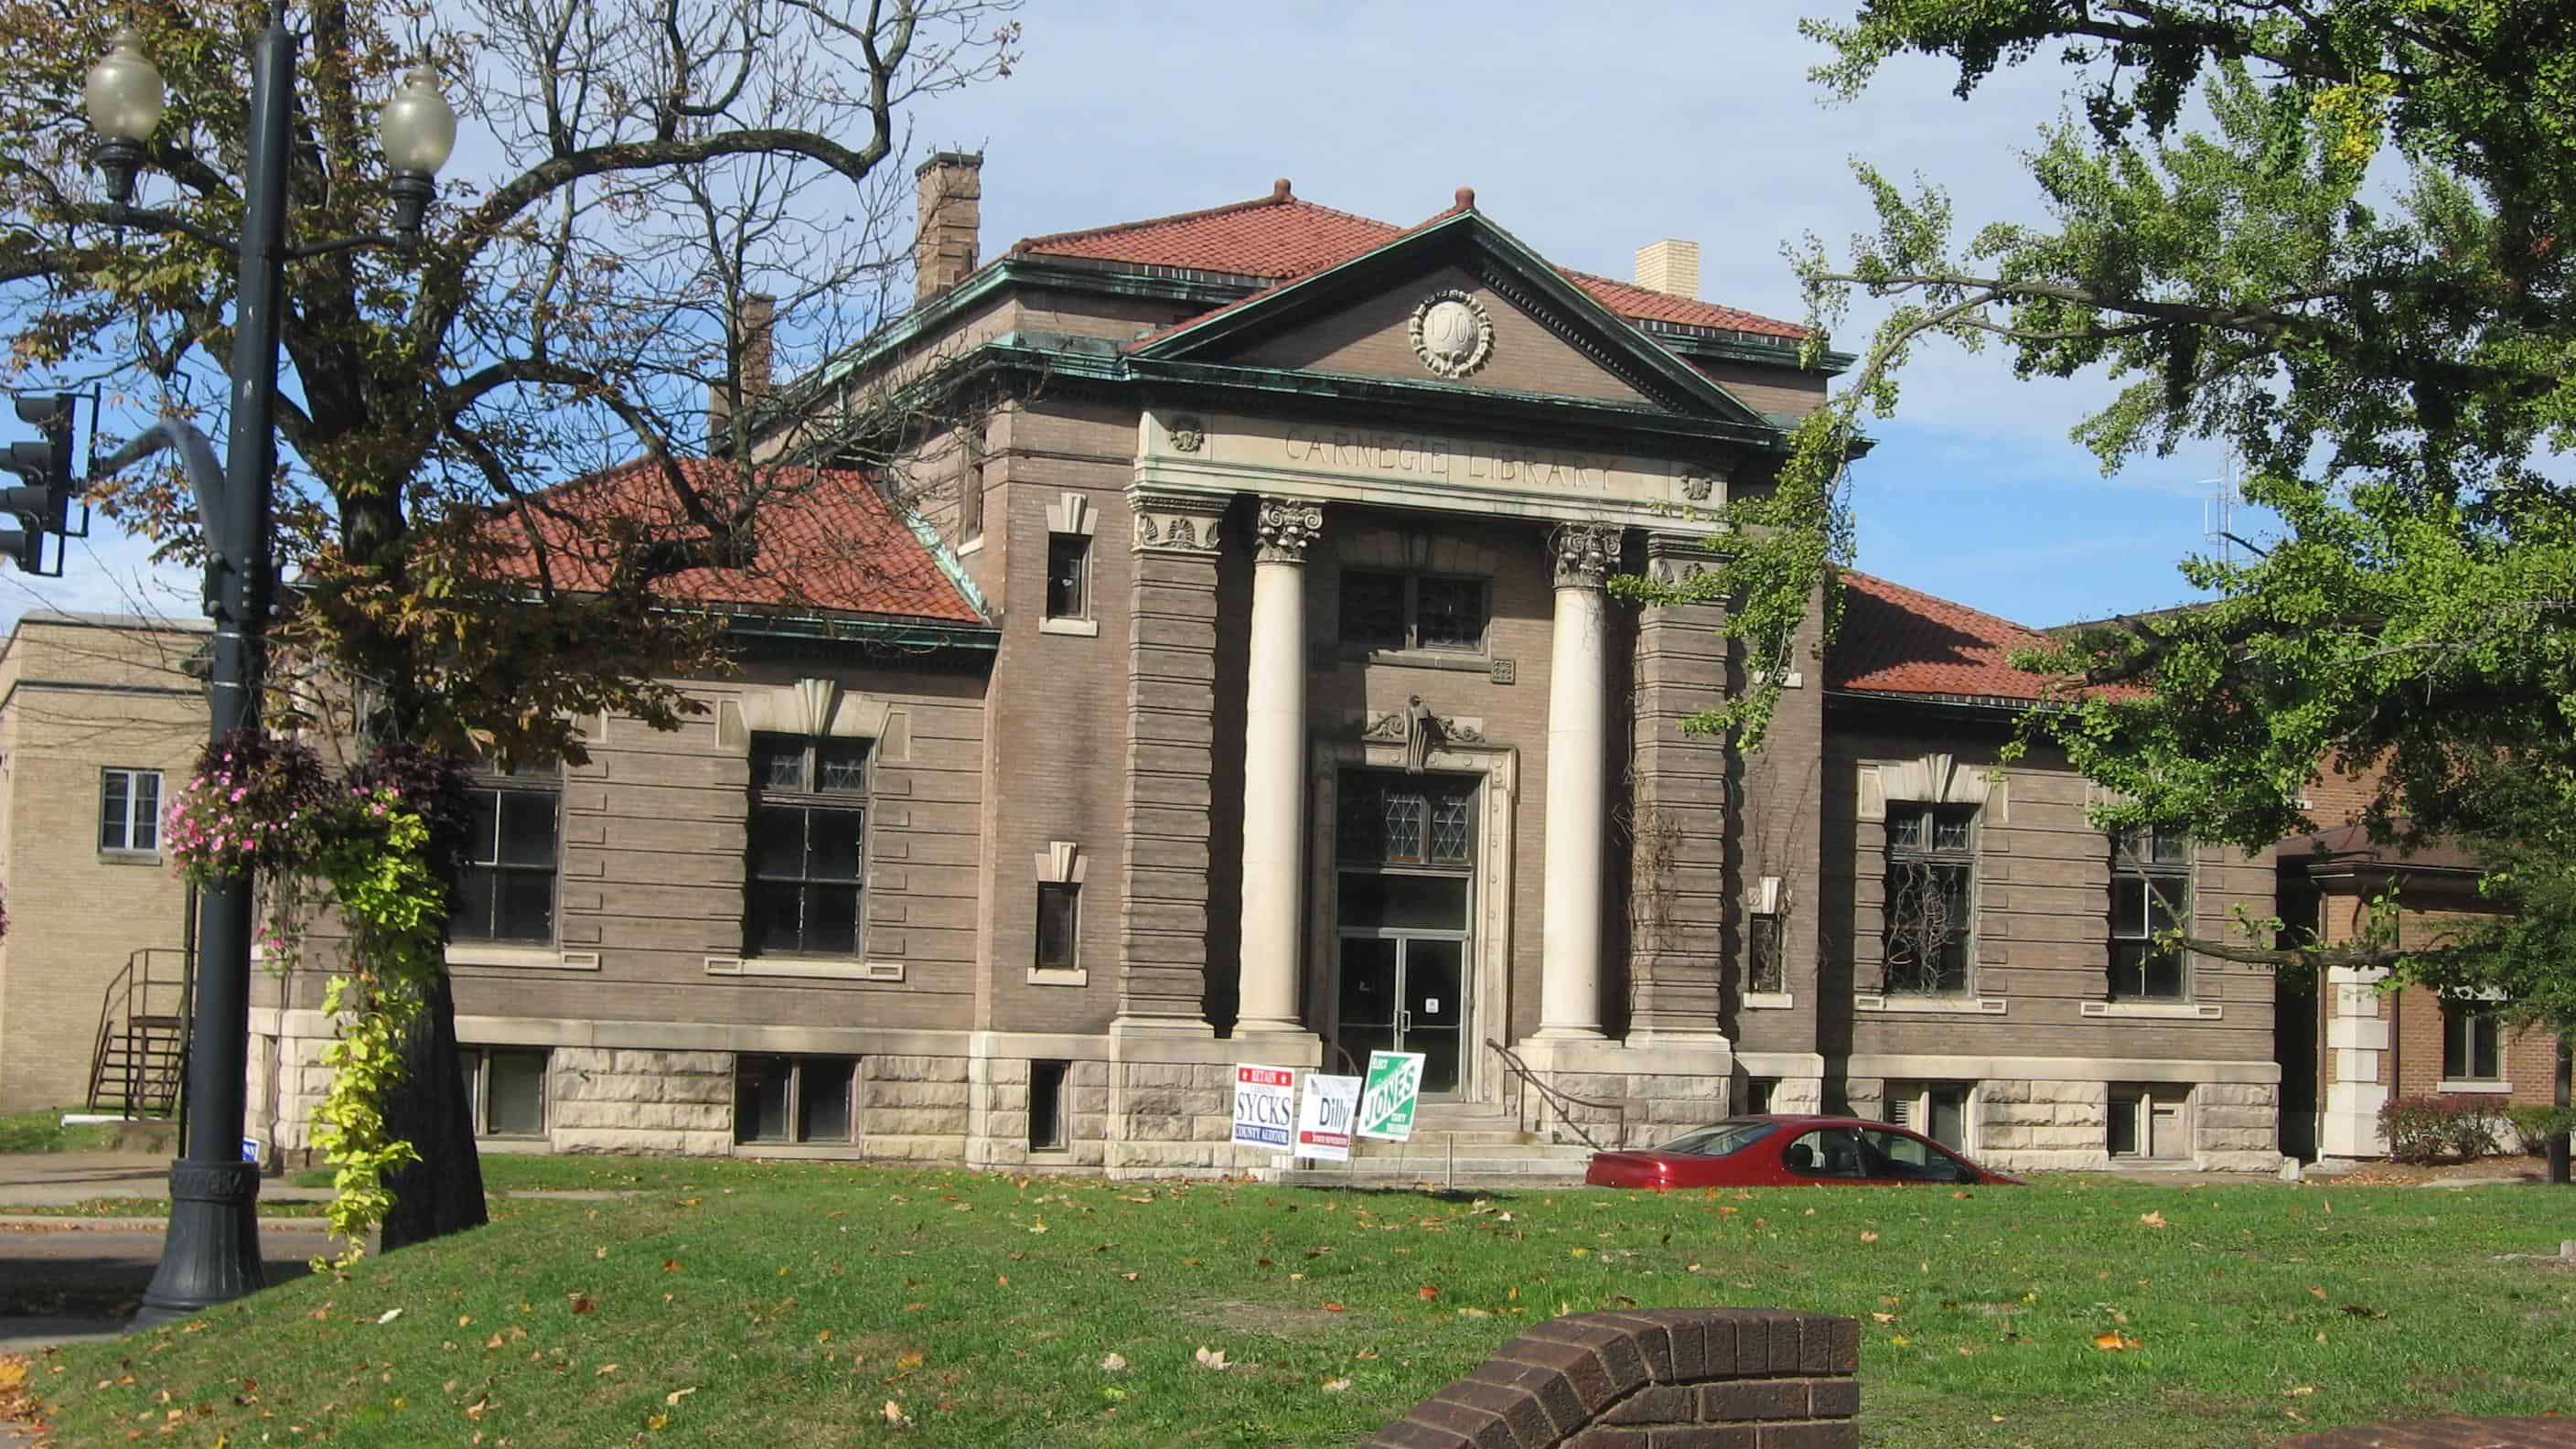
22. Hillsboro
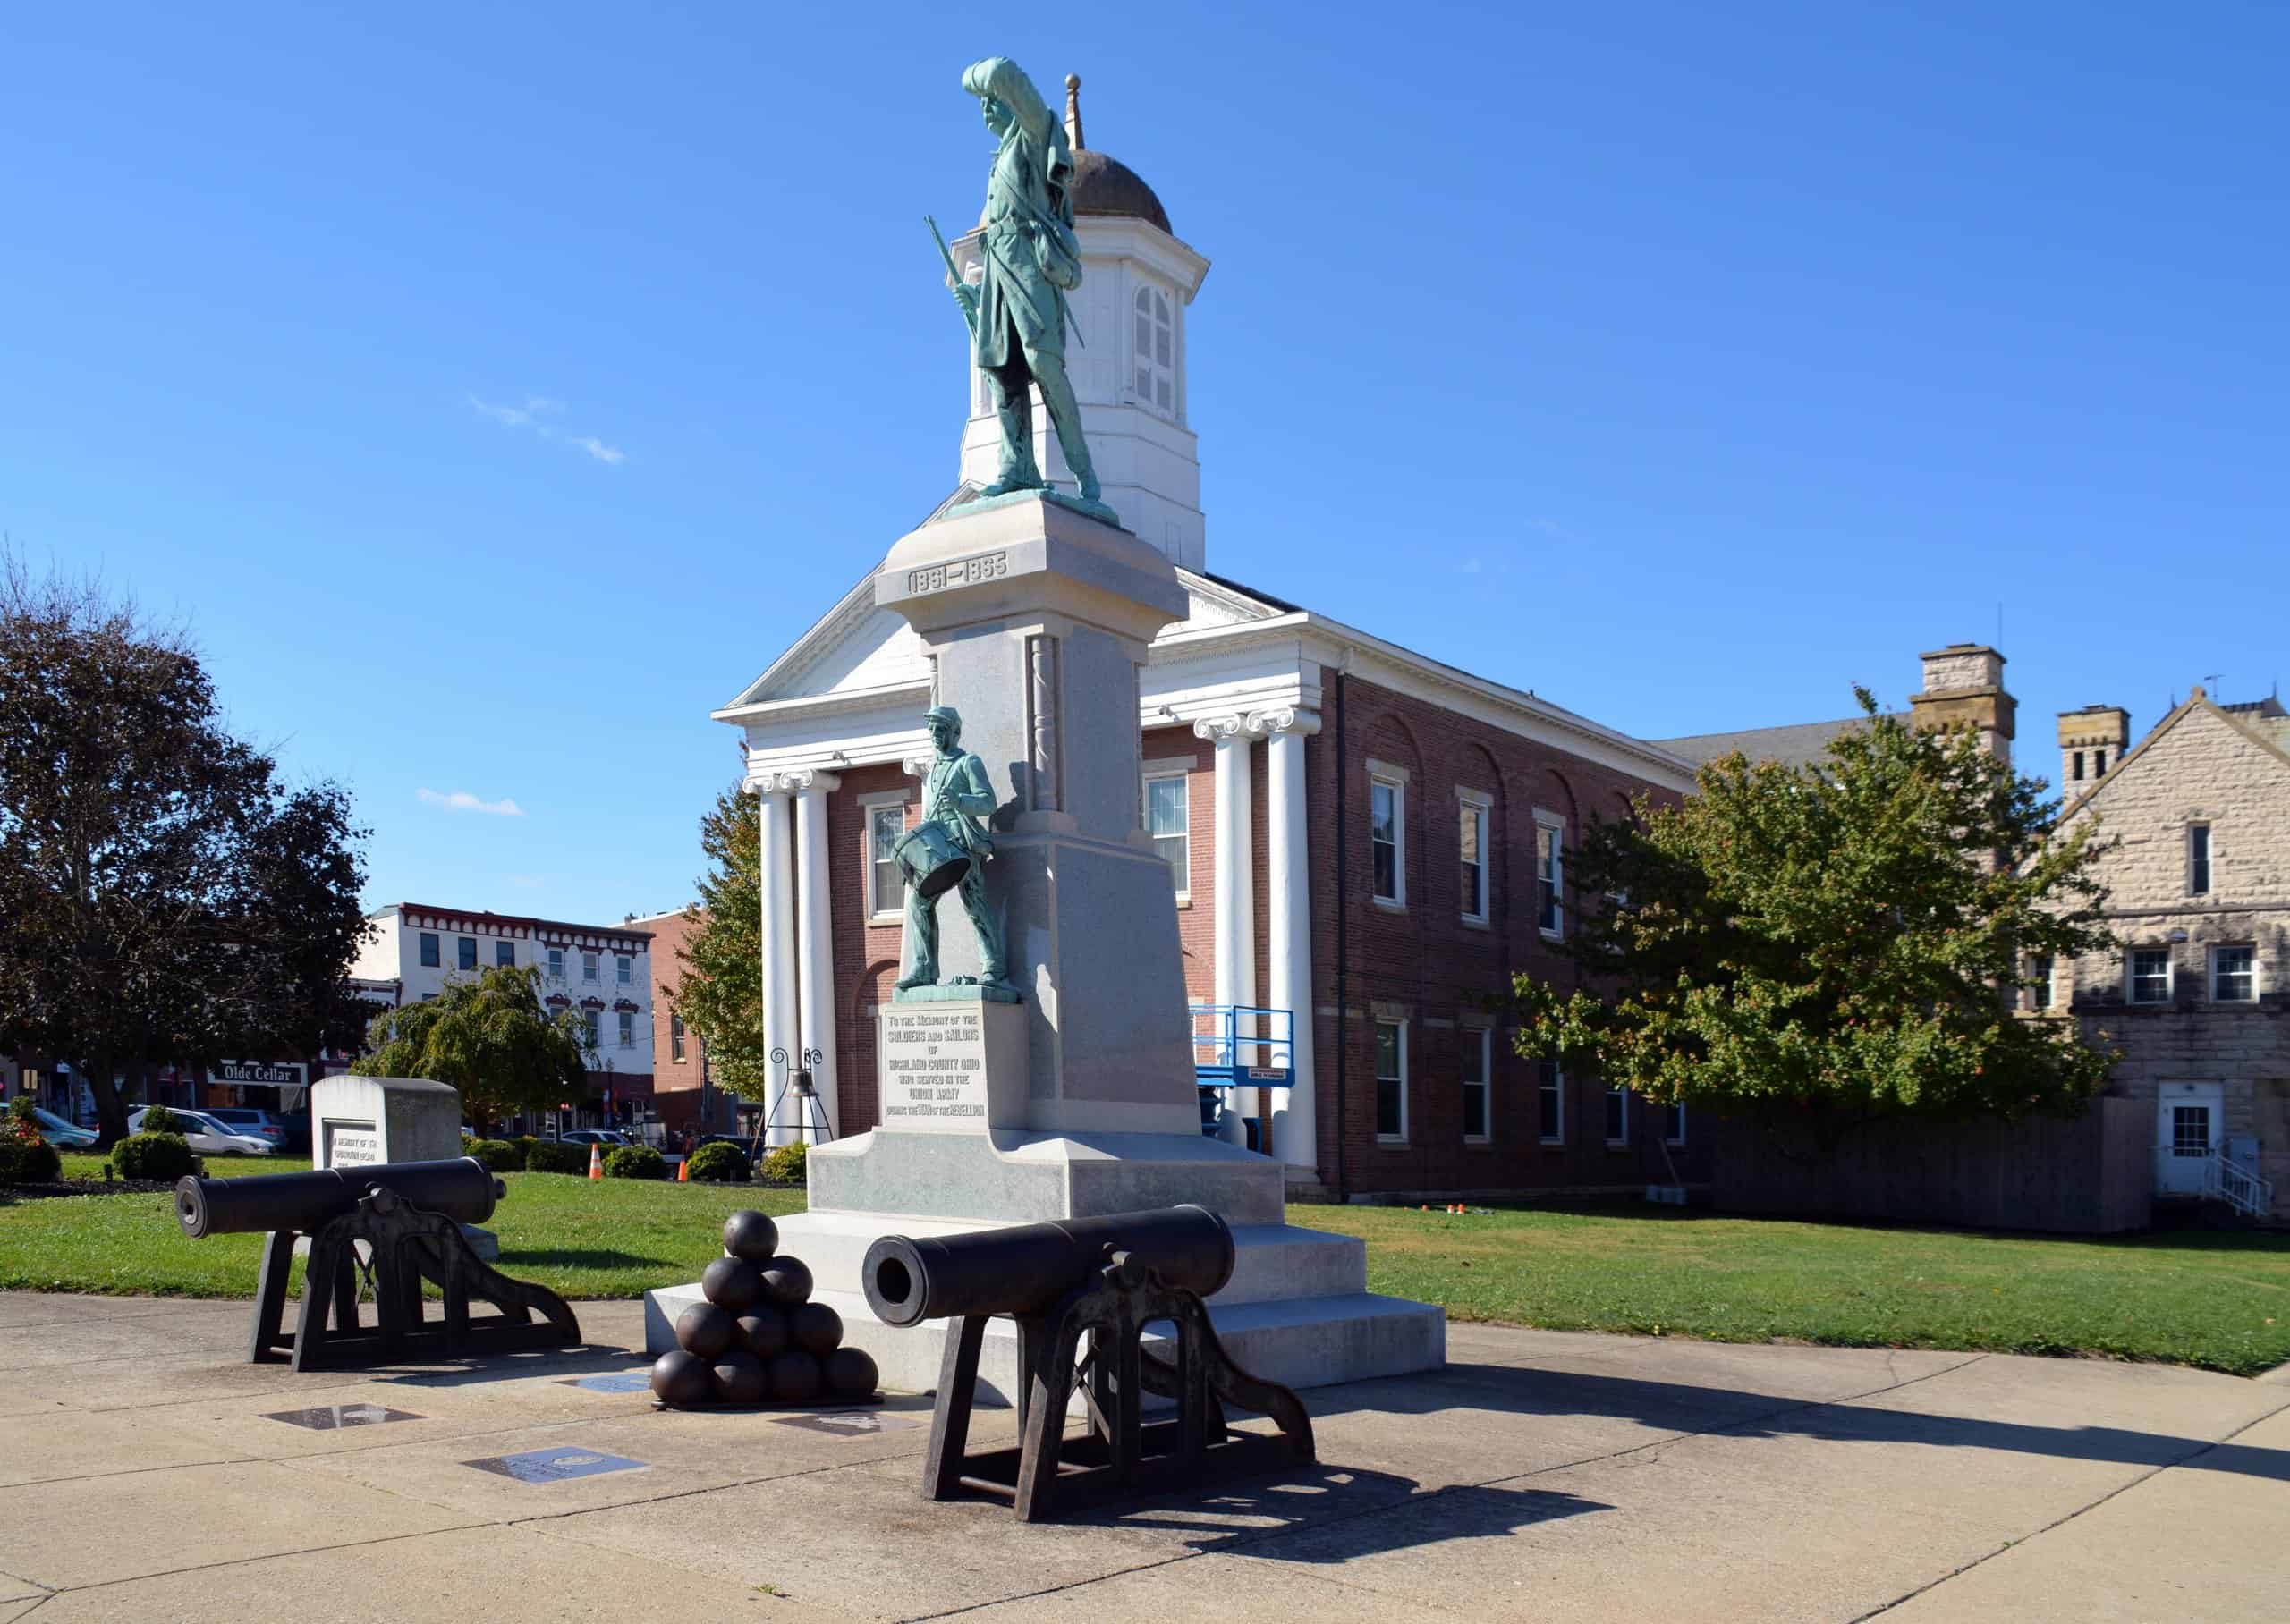
Source: BOB WESTON / iStock via Getty Images
- Poverty rate: 23.1%
- Median household income: $44,731
- 5-yr. avg. unemployment rate: 5.0%
- Adults with a bachelor’s degree or higher: 16.8%
- Population: 6,492
21. Lima

- Poverty rate: 23.1%
- Median household income: $41,824
- 5-yr. avg. unemployment rate: 8.6%
- Adults with a bachelor’s degree or higher: 10.7%
- Population: 35,555
20. Circleville
Source: Jacqueline Nix / iStock Editorial via Getty Images
- Poverty rate: 23.2%
- Median household income: $51,830
- 5-yr. avg. unemployment rate: 9.3%
- Adults with a bachelor’s degree or higher: 19.4%
- Population: 14,017
19. Coshocton
Source: Public Domain / Wikimedia Commons
- Poverty rate: 23.2%
- Median household income: $47,184
- 5-yr. avg. unemployment rate: 9.2%
- Adults with a bachelor’s degree or higher: 19.8%
- Population: 11,054
18. Trotwood

Source: Public Domain / Wikimedia Commons
- Poverty rate: 23.8%
- Median household income: $46,442
- 5-yr. avg. unemployment rate: 8.4%
- Adults with a bachelor’s degree or higher: 18.3%
- Population: 23,125
17. Shiloh
Source: Public Domain / Wikimedia Commons
- Poverty rate: 23.8%
- Median household income: $43,256
- 5-yr. avg. unemployment rate: 8.2%
- Adults with a bachelor’s degree or higher: 25.9%
- Population: 10,539
16. North College Hill

Source: Public Domain / Wikimedia Commons
- Poverty rate: 24.2%
- Median household income: $51,971
- 5-yr. avg. unemployment rate: 8.8%
- Adults with a bachelor’s degree or higher: 17.0%
- Population: 9,602
15. Ironton
Source: larrybraunphotography.com / Moment via Getty Images
- Poverty rate: 24.6%
- Median household income: $43,702
- 5-yr. avg. unemployment rate: 6.4%
- Adults with a bachelor’s degree or higher: 20.0%
- Population: 10,597
14. Mansfield

- Poverty rate: 25.0%
- Median household income: $40,996
- 5-yr. avg. unemployment rate: 7.8%
- Adults with a bachelor’s degree or higher: 15.9%
- Population: 47,630
13. Zanesville
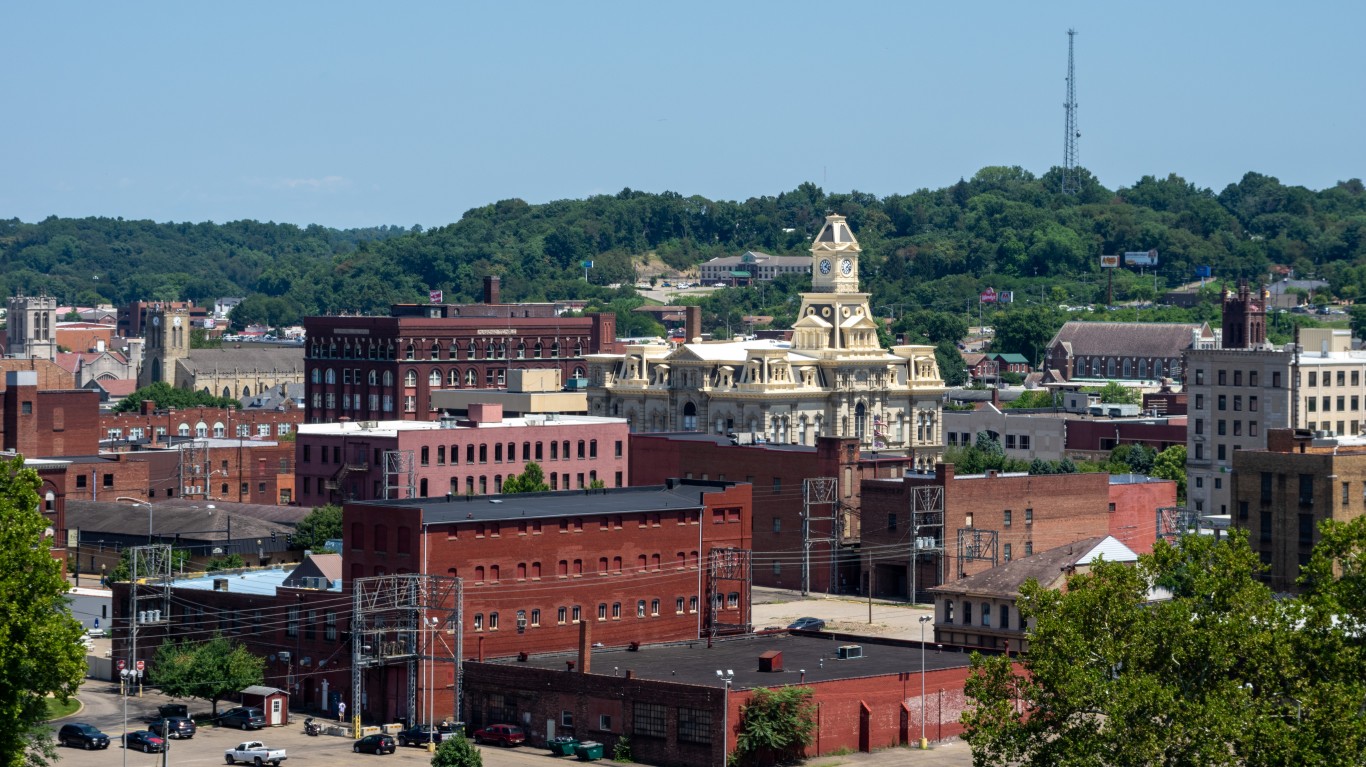
Source: weaver1234 / iStock via Getty Images
- Poverty rate: 25.2%
- Median household income: $40,927
- 5-yr. avg. unemployment rate: 8.5%
- Adults with a bachelor’s degree or higher: 13.0%
- Population: 24,772
12. Moraine

Source: Public Domain / Wikimedia Commons
- Poverty rate: 25.5%
- Median household income: $40,793
- 5-yr. avg. unemployment rate: 4.4%
- Adults with a bachelor’s degree or higher: 14.5%
- Population: 6,484
11. New Burlington

Source: Rcsprinter123 / Wikimedia Commons
- Poverty rate: 25.6%
- Median household income: $58,092
- 5-yr. avg. unemployment rate: 2.0%
- Adults with a bachelor’s degree or higher: 27.0%
- Population: 5,321
10. Logan
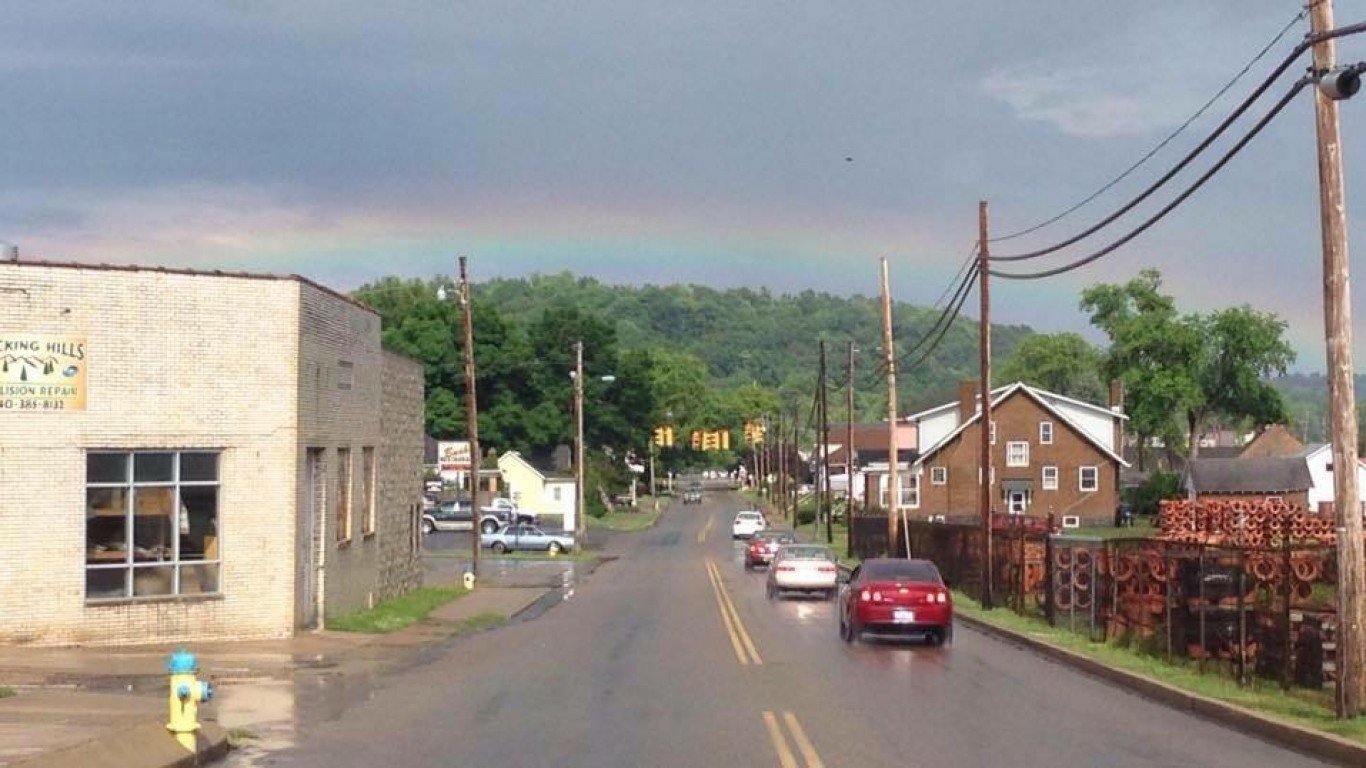
Source: 140641142@N05 / Flickr / Public Domain
- Poverty rate: 25.7%
- Median household income: $46,762
- 5-yr. avg. unemployment rate: 3.0%
- Adults with a bachelor’s degree or higher: 13.3%
- Population: 7,168
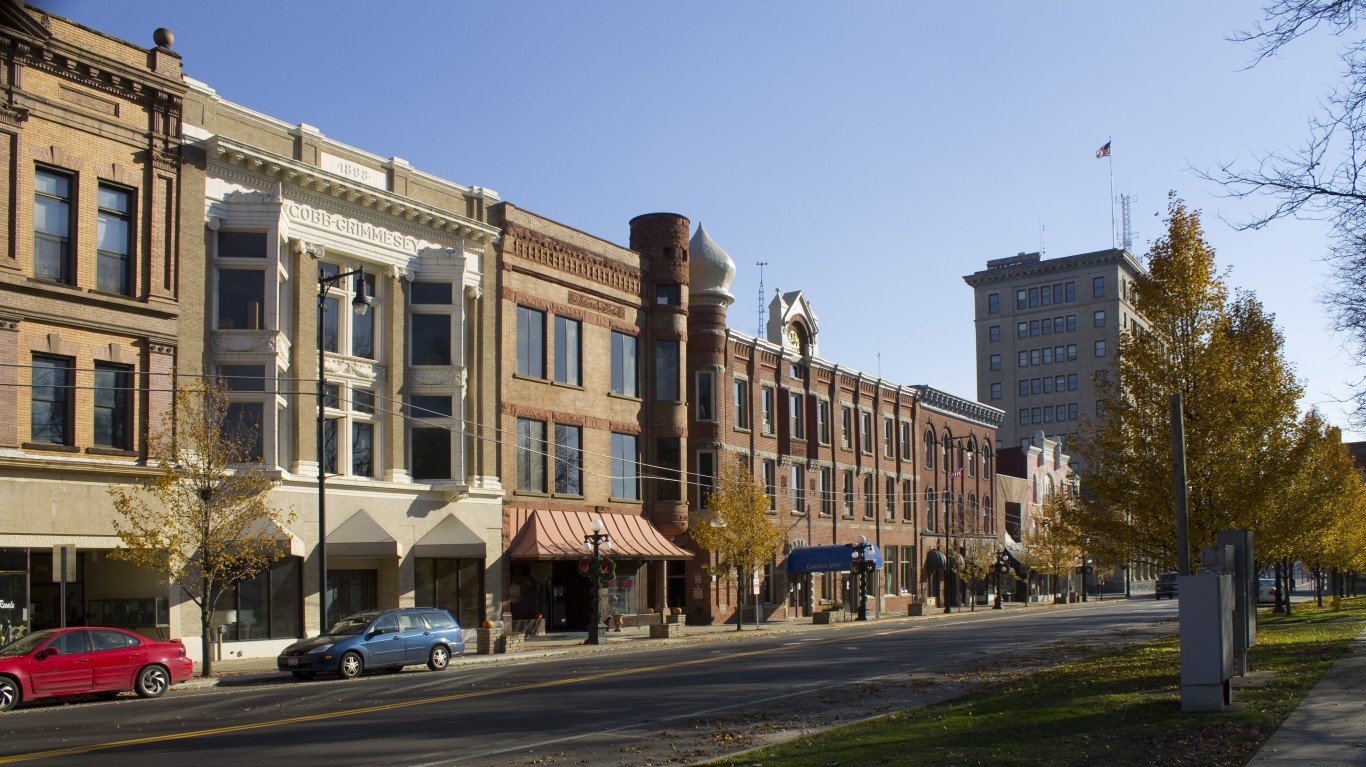
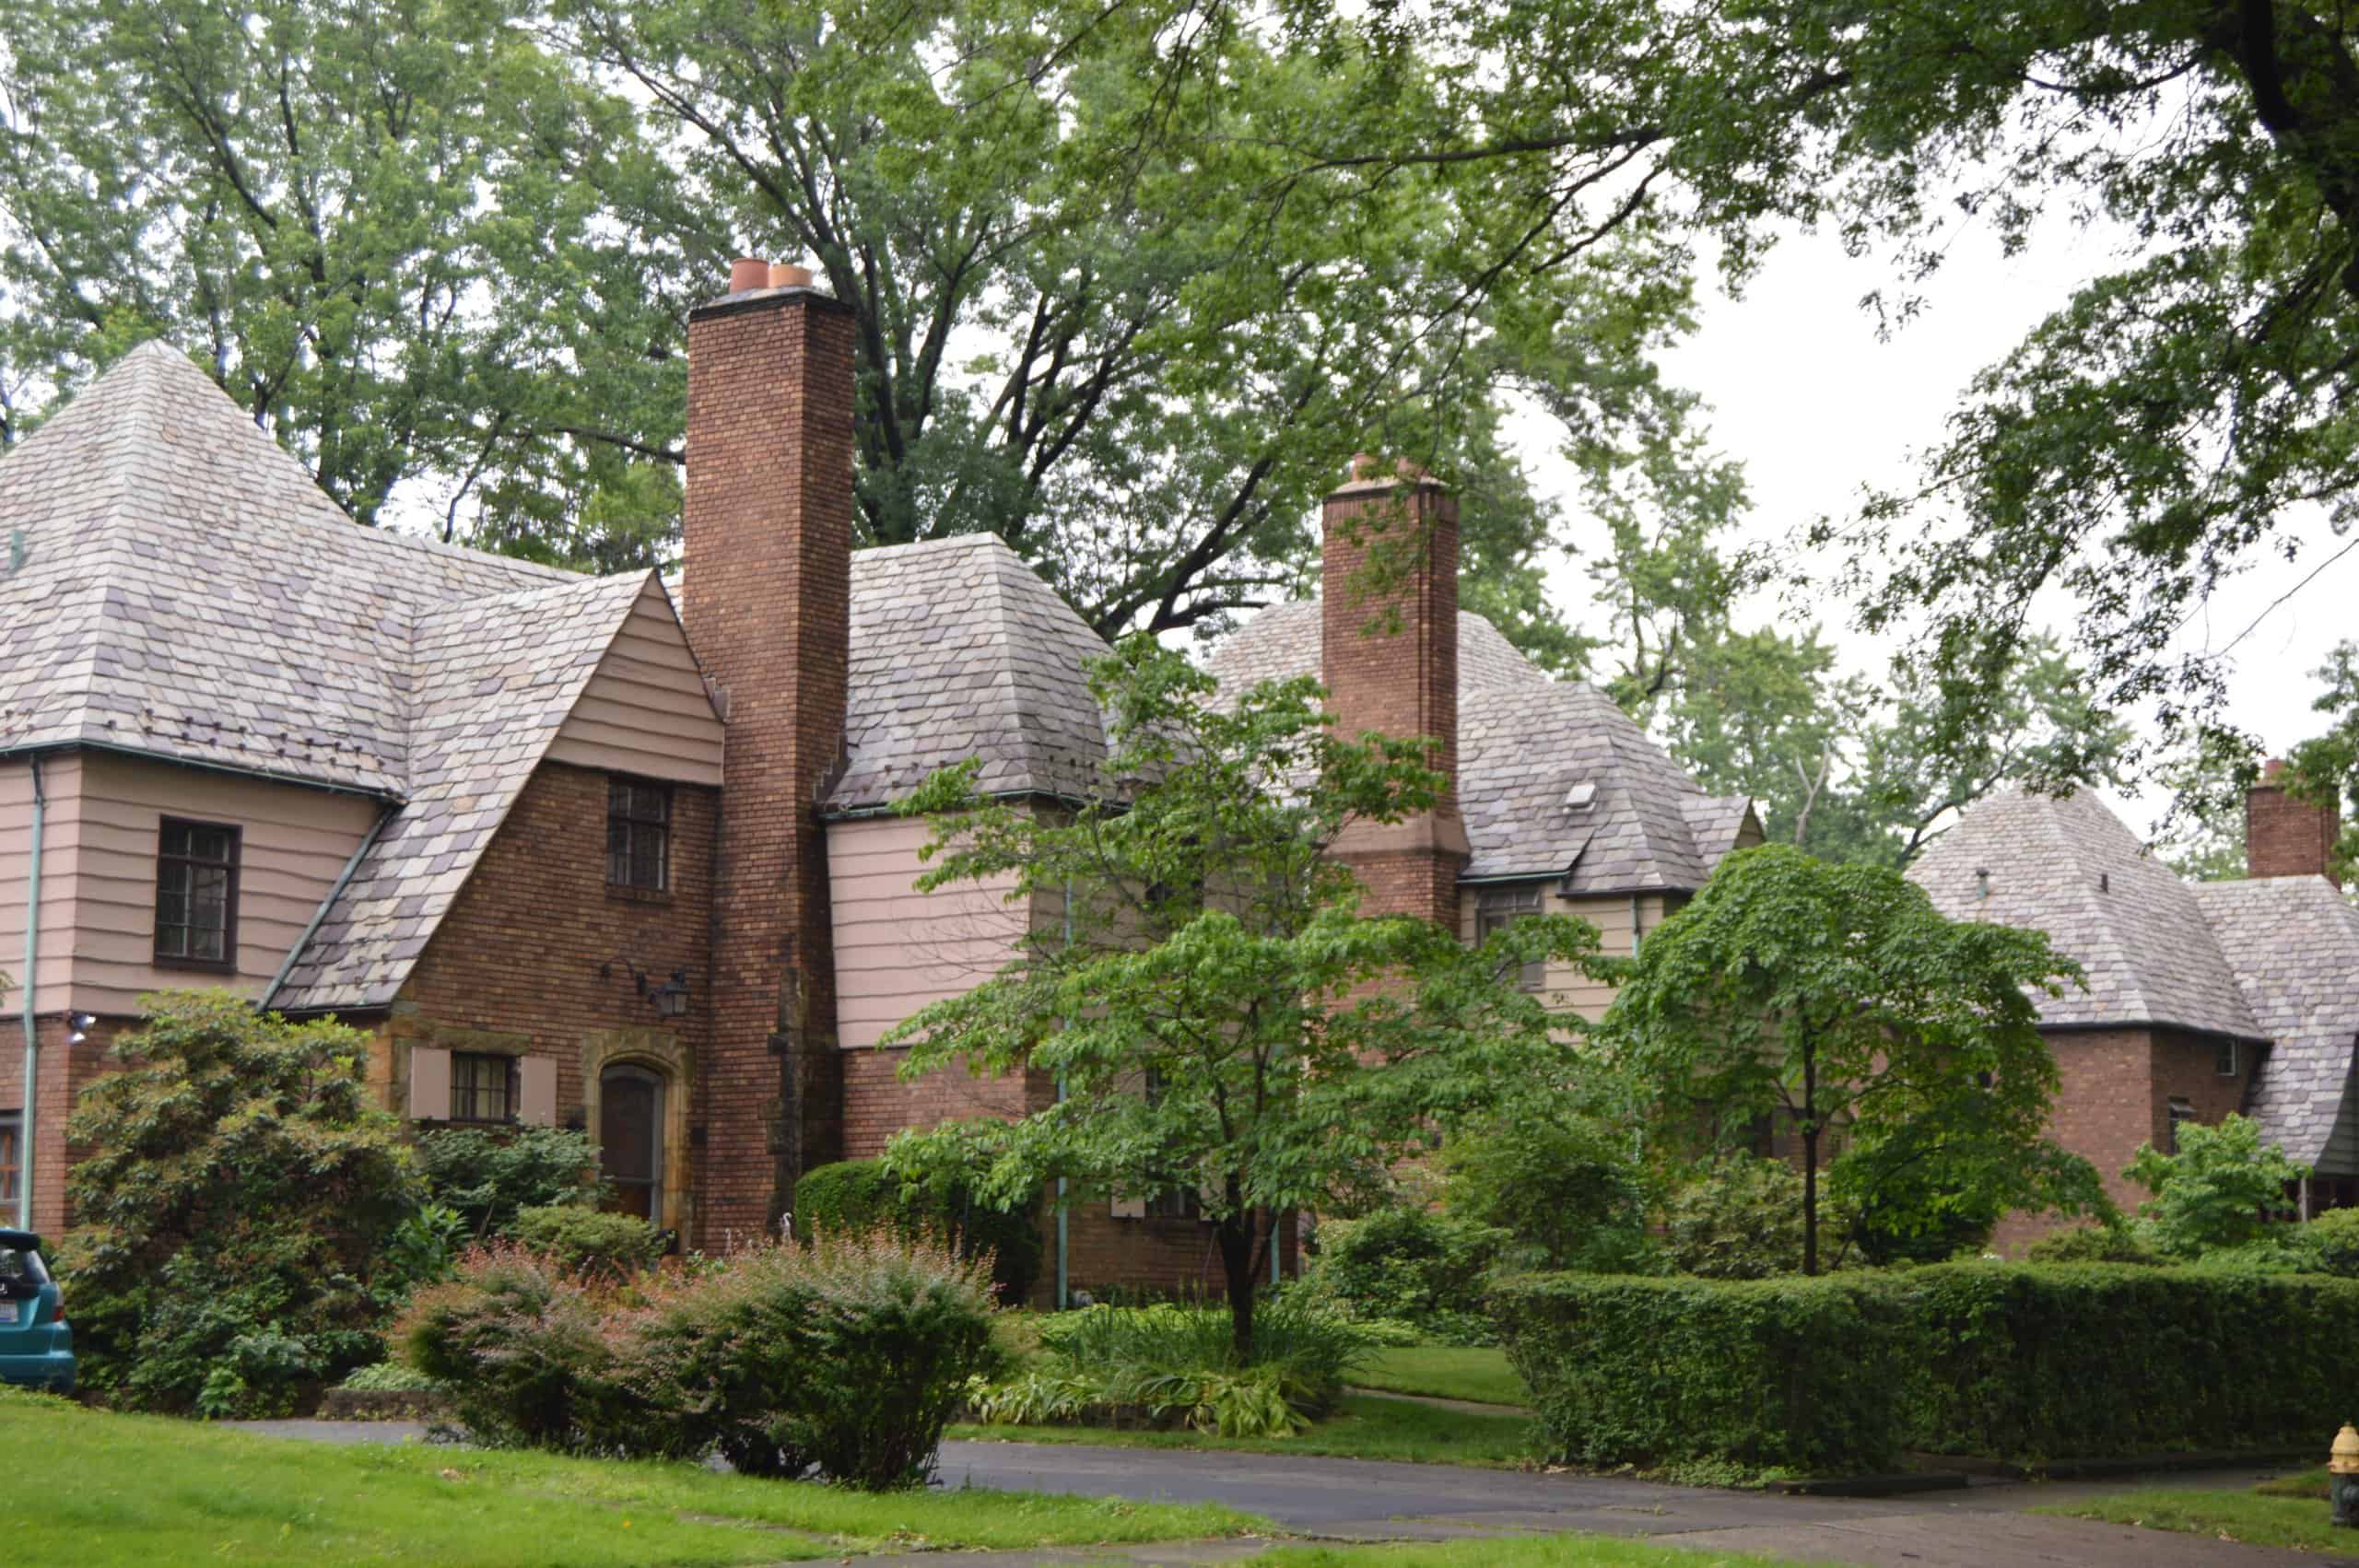
9. Steubenville

- Poverty rate: 27.9%
- Median household income: $42,725
- 5-yr. avg. unemployment rate: 7.6%
- Adults with a bachelor’s degree or higher: 28.4%
- Population: 18,175
8. Campbell
Source: Public Domain / Wikimedia Commons
- Poverty rate: 28.7%
- Median household income: $43,176
- 5-yr. avg. unemployment rate: 13.5%
- Adults with a bachelor’s degree or higher: 17.2%
- Population: 7,819
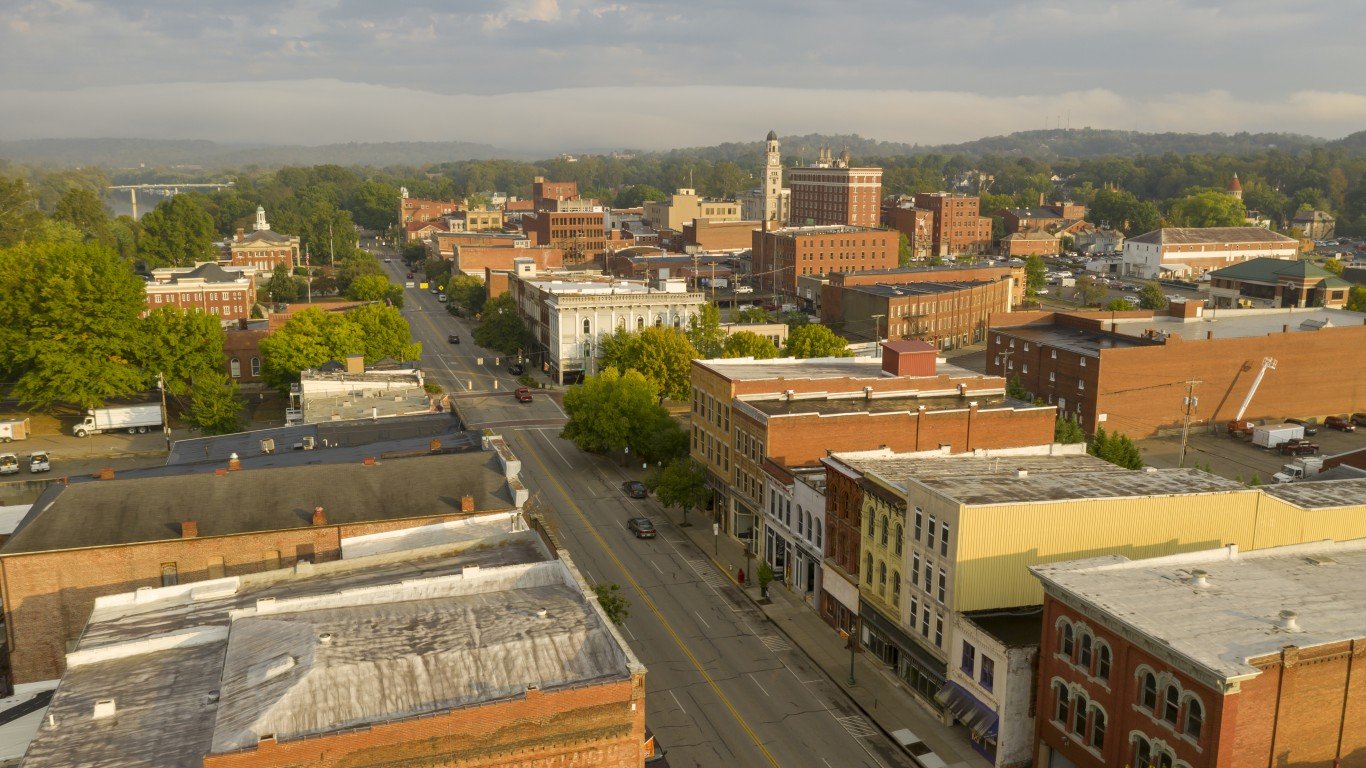
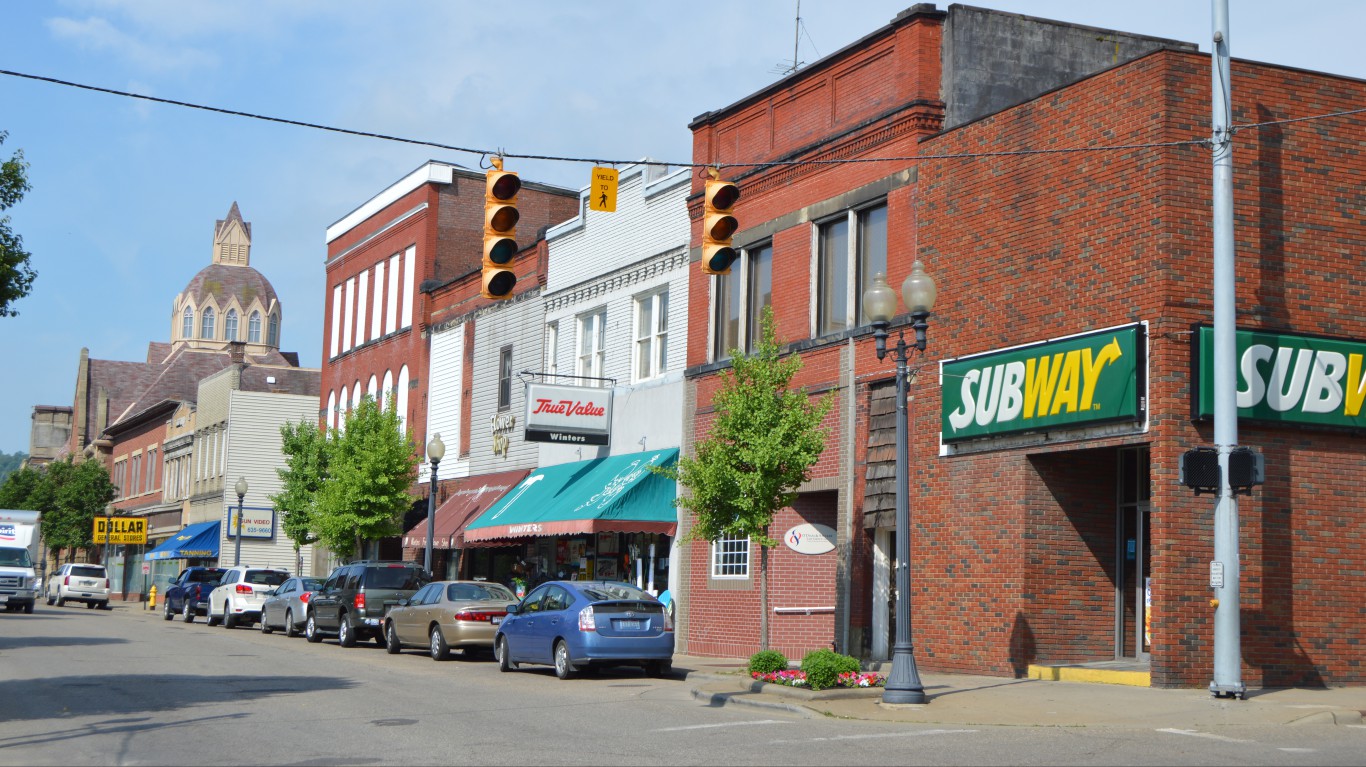
7. Cambridge

Source: Henryk Sadura / Tetra images via Getty Images
- Poverty rate: 30.2%
- Median household income: $39,589
- 5-yr. avg. unemployment rate: 2.5%
- Adults with a bachelor’s degree or higher: 13.4%
- Population: 10,087
6. East Liverpool

Source: Spencer Platt / Getty Images News via Getty Images
- Poverty rate: 31.6%
- Median household income: $34,560
- 5-yr. avg. unemployment rate: 6.1%
- Adults with a bachelor’s degree or higher: 8.1%
- Population: 9,969
5. Martins Ferry
Source: Public Domain / Wikimedia Commons
- Poverty rate: 32.4%
- Median household income: $39,195
- 5-yr. avg. unemployment rate: 20.8%
- Adults with a bachelor’s degree or higher: 10.7%
- Population: 6,283
4. Ashtabula

Source: benkrut / iStock via Getty Images
- Poverty rate: 32.7%
- Median household income: $39,053
- 5-yr. avg. unemployment rate: 13.6%
- Adults with a bachelor’s degree or higher: 11.6%
- Population: 18,003
3. Warren
Source: Jack Pearce from Boardman, OH, USA / Wikimedia Commons
- Poverty rate: 35.0%
- Median household income: $33,296
- 5-yr. avg. unemployment rate: 8.6%
- Adults with a bachelor’s degree or higher: 15.2%
- Population: 39,204
2. Portsmouth

- Poverty rate: 35.4%
- Median household income: $36,051
- 5-yr. avg. unemployment rate: 11.5%
- Adults with a bachelor’s degree or higher: 16.7%
- Population: 18,130
1. East Cleveland
Source: Public Domain / Wikimedia Commons
- Poverty rate: 39.5%
- Median household income: $23,004
- 5-yr. avg. unemployment rate: 19.3%
- Adults with a bachelor’s degree or higher: 14.9%
- Population: 13,926
| Rank | Place | Poverty rate (%) | Median household income ($) | Unemployment rate (%) | Adults with a bachelor’s degree or higher (%) | Total population |
|---|---|---|---|---|---|---|
| 1 | East Cleveland, Ohio | 39.5 | 23,004 | 19.3 | 14.9 | 13,926 |
| 2 | Portsmouth, Ohio | 35.4 | 36,051 | 11.5 | 16.7 | 18,130 |
| 3 | Warren, Ohio | 35.0 | 33,296 | 8.6 | 15.2 | 39,204 |
| 4 | Ashtabula, Ohio | 32.7 | 39,053 | 13.6 | 11.6 | 18,003 |
| 5 | Martins Ferry, Ohio | 32.4 | 39,195 | 20.8 | 10.7 | 6,283 |
| 6 | East Liverpool, Ohio | 31.6 | 34,560 | 6.1 | 8.1 | 9,969 |
| 7 | Cambridge, Ohio | 30.2 | 39,589 | 2.5 | 13.4 | 10,087 |
| 8 | Campbell, Ohio | 28.7 | 43,176 | 13.5 | 17.2 | 7,819 |
| 9 | Steubenville, Ohio | 27.9 | 42,725 | 7.6 | 28.4 | 18,175 |
| 10 | Logan, Ohio | 25.7 | 46,762 | 3.0 | 13.3 | 7,168 |
| 11 | New Burlington, Ohio | 25.6 | 58,092 | 2.0 | 27.0 | 5,321 |
| 12 | Moraine, Ohio | 25.5 | 40,793 | 4.4 | 14.5 | 6,484 |
| 13 | Zanesville, Ohio | 25.2 | 40,927 | 8.5 | 13.0 | 24,772 |
| 14 | Mansfield, Ohio | 25.0 | 40,996 | 7.8 | 15.9 | 47,630 |
| 15 | Ironton, Ohio | 24.6 | 43,702 | 6.4 | 20.0 | 10,597 |
| 16 | North College Hill, Ohio | 24.2 | 51,971 | 8.8 | 17.0 | 9,602 |
| 17 | Shiloh, Ohio | 23.8 | 43,256 | 8.2 | 25.9 | 10,539 |
| 18 | Trotwood, Ohio | 23.8 | 46,442 | 8.4 | 18.3 | 23,125 |
| 19 | Coshocton, Ohio | 23.2 | 47,184 | 9.2 | 19.8 | 11,054 |
| 20 | Circleville, Ohio | 23.2 | 51,830 | 9.3 | 19.4 | 14,017 |
| 21 | Lima, Ohio | 23.1 | 41,824 | 8.6 | 10.7 | 35,555 |
| 22 | Hillsboro, Ohio | 23.1 | 44,731 | 5.0 | 16.8 | 6,492 |
| 23 | Alliance, Ohio | 23.1 | 51,721 | 4.0 | 18.0 | 21,603 |
| 24 | Uhrichsville, Ohio | 22.5 | 42,155 | 10.2 | 10.5 | 5,238 |
| 25 | Wellston, Ohio | 22.3 | 51,597 | 5.6 | 7.0 | 5,420 |
| 26 | Jackson, Ohio | 22.1 | 51,864 | 4.8 | 16.5 | 6,222 |
| 27 | Marietta, Ohio | 22.0 | 44,401 | 5.6 | 30.0 | 13,366 |
| 28 | Garfield Heights, Ohio | 22.0 | 49,864 | 9.8 | 15.0 | 29,497 |
| 29 | Marion, Ohio | 21.8 | 44,879 | 8.7 | 10.1 | 35,927 |
| 30 | Maple Heights, Ohio | 21.6 | 49,877 | 8.3 | 15.7 | 23,473 |
| 31 | New Carlisle, Ohio | 21.4 | 56,744 | 17.1 | 13.4 | 5,579 |
| 32 | Wilmington, Ohio | 21.1 | 48,407 | 5.0 | 22.2 | 12,669 |
| 33 | Fostoria, Ohio | 21.0 | 53,145 | 5.8 | 11.2 | 12,904 |
| 34 | Port Clinton, Ohio | 20.7 | 55,534 | 5.2 | 18.0 | 6,024 |
| 35 | Warrensville Heights, Ohio | 20.7 | 43,848 | 10.2 | 19.6 | 13,659 |
Smart Investors Are Quietly Loading Up on These “Dividend Legends”
If you want your portfolio to pay you cash like clockwork, it’s time to stop blindly following conventional wisdom like relying on Dividend Aristocrats. There’s a better option, and we want to show you. We’re offering a brand-new report on 2 stocks we believe offer the rare combination of a high dividend yield and significant stock appreciation upside. If you’re tired of feeling one step behind in this market, this free report is a must-read for you.
Click here to download your FREE copy of “2 Dividend Legends to Hold Forever” and start improving your portfolio today.
Thank you for reading! Have some feedback for us?
Contact the 24/7 Wall St. editorial team.
Editors' Picks