
With the exception of the last two years, when it dropped largely because of spikes in opioid deaths, life expectancy in the United States has generally been increasing.
According to the latest available data, a baby born in 2016 in the United States can be expected to live 78.6 years on average, more than seven years longer than a baby born in 1980. The increase in life expectancy at birth, as well as the likelihood of living a long life, vary considerably across the United States.
To identify the states where people are expected to live the longest, 24/7 Wall St. reviewed life expectancy at birth figures for 2010-2015 obtained from the National Association for Public Health Statistics and Information Systems (NAPHSIS) and the Robert Wood Johnson Foundation (RWJF).
Life expectancy in some states increased by just three years since 1980, and by as much as nine years in others. These variations are closely related to differences in a host of factors. For example, long-standing research has found that Americans with lower socioeconomic status tend to have lower life expectancies than more affluent Americans.
Click here to see the states where people live the longest.
Click here to read our detailed findings and methodology.

50. Mississippi
> Life expectancy at birth in 2015: 74.7 years
> Life expectancy at birth in 1980: 71.6 years (2nd lowest)
> 1980-2015 life expectancy change: 3.1 years (5th smallest)
Life expectancy at birth in Mississippi is the lowest of all states and has historically been low. As is generally the case in states with low life expectancy, Mississippi struggles with poverty, and residents report relatively unhealthy behaviors. At 19.8%, no state has a higher poverty rate. Mississippi also has the largest share of adults who do not exercise, at more than a third of the local adult population.
[in-text-ad]

49. West Virginia
> Life expectancy at birth in 2015: 75.3 years
> Life expectancy at birth in 1980: 72.8 years (10th lowest)
> 1980-2015 life expectancy change: 2.5 years (2nd smallest)
Like every other state, life expectancy in West Virginia has improved in recent decades. Even though a baby born in West Virginia is expected to live longer than a newborn in 1980, the 2.5 year increase was the second smallest. The state’s life expectancy rank dropped from 10th lowest in 1980 to second lowest of all states in 2015.
Obesity and smoking may be contributing factors. Mortality among smokers in the United States is three times higher than among people who have never smoked, and West Virginia has the highest adult smoking rate, at 24.8%. The state’s adult obesity rate of 35.5% is also the highest of all states.
[recirclink id=488456]

48. Alabama
> Life expectancy at birth in 2015: 75.4 years
> Life expectancy at birth in 1980: 72.3 years (5th lowest)
> 1980-2015 life expectancy change: 3.1 years (6th smallest)
Similar to other states with the shortest life expectancies, Alabama struggles with poverty, and residents report relatively unhealthy behaviors, such as adult obesity, physical inactivity, and smoking.
Because of access to often expensive medical care, as well as other factors, income is one of the strongest predictors of life expectancy. But so is educational attainment. A 2014 study found individuals in the lowest income quartile had more healthful behaviors and lived longer in areas with more college graduates. The share of adults with a bachelor’s degree or higher in the Cotton State is low, at 25.5%.

47. Louisiana
> Life expectancy at birth in 2015: 75.6 years
> Life expectancy at birth in 1980: 71.6 years (the lowest)
> 1980-2015 life expectancy change: 4.0 years (15th smallest)
Poverty and poor health are closely related. Having little money increases the chance of poor health because of poorer access to health care and to healthy food and lifestyle choices. Further, the cost of going to the doctor as well as the possible treatment that may follow can be devastating financially.
Louisiana is the state with the second largest share of the population living below the poverty line. Relatively high numbers of households in the state live on incomes considerably lower than the poverty threshold. The Creole State has the highest number of households living with less than $10,000 a year.
[in-text-ad-2]

46. Oklahoma
> Life expectancy at birth in 2015: 75.7 years
> Life expectancy at birth in 1980: 73.6 years (23rd lowest)
> 1980-2015 life expectancy change: 2.1 years (the smallest)
Life expectancy at birth in Oklahoma has increased since 1980 by just over two years, the smallest increase among all 50 states. In 1980, Oklahoma was ranked 23rd in life expectancy. By 2015, its rank had dropped to 46th.
In addition to excessive drinking, obesity, and lack of physical activity — the Sooner State ranks high in all three — Oklahoma has the second highest share of the population without health insurance, at 14.2%. Research has shown that uninsured adults have worse access to care, receive poorer quality of care, and experience worse health outcomes than insured adults.

45. Kentucky
> Life expectancy at birth in 2015: 75.8 years
> Life expectancy at birth in 1980: 72.9 years (13th lowest)
> 1980-2015 life expectancy change: 2.9 years (4th smallest)
Even though only 5.4% of Kentucky’s population does not have health insurance, many residents engage in unhealthy behaviors — the state has the the sixth largest share of adults who are obese and the second largest share of adults who smoke.
In addition, there are just over 66 primary care doctors available for every 100,000 residents of the Bluegrass State, the ninth lowest ratio in the country. Lack of primary care has been linked to poor health. Kentucky has the highest share of Medicare enrollees who would not have had to be hospitalized had they seen a doctor, at 76 per 1,000 people.
[in-text-ad]

44. Arkansas
> Life expectancy at birth in 2015: 75.8 years
> Life expectancy at birth in 1980: 72.9 years (14th lowest)
> 1980-2015 life expectancy change: 2.9 years (3rd smallest)
Life expectancy in Arkansas is longer compared to 1980 but only by 2.9 years, the third smallest increase in the United States over that time period. Lack of physical activity, which is a major cause of chronic diseases, may partially explain the relatively small improvement.
The state has the second lowest share of adult residents who exercise regularly, at just over 32%, and the fifth lowest share of the local population with access to places for physical activity. Adult residents report feeling unhealthy an average of five days a month, the second most in the country.
[recirclink id=488594]

43. Tennessee
> Life expectancy at birth in 2015: 76.1 years
> Life expectancy at birth in 1980: 72.8 years (12th lowest)
> 1980-2015 life expectancy change: 3.3 years (7th smallest)
As is frequently the case in states with relatively low life expectancies, Tennessee has among the highest poverty, obesity, and smoking rates. The average number of both mentally and physically unhealthy days per month reported by state residents are also some of the highest compared with other states. .
Lack of access to high quality medical care is also a major factor in life expectancy. Tennessee is one of several states that have not expanded Medicaid to single, low-income adults between 19 and 64 years of age.

42. South Carolina
> Life expectancy at birth in 2015: 76.8 years
> Life expectancy at birth in 1980: 71.8 years (3rd lowest)
> 1980-2015 life expectancy change: 5.0 years (19th largest)
The average newborn in South Carolina is expected to live 76.8 years, versus the national average life expectancy at birth of 78.6 years.
No other state has fewer people with access to a gym or other place where they can exercise, at only 54.2% of the state’s adult population. Staying physically active is a key component of a healthy lifestyle. Regular exercise can help prevent obesity, which is associated with a host of adverse health outcomes. South Carolina’s obesity rate of 32.0% is the 10th highest of all states.
[in-text-ad-2]

41. Indiana
> Life expectancy at birth in 2015: 77.2 years
> Life expectancy at birth in 1980: 73.6 years (24th lowest)
> 1980-2015 life expectancy change: 3.8 years (9th smallest)
While life expectancies have risen in all states over recent decades, life expectancy has declined in some states since 2014. Indiana’s life expectancy at birth in 2014 was 77.7 years; it is now 77.2 years. As is the case in many states, the decline in life expectancy is mostly due to rise in suicides and fatal drug overdoses, according to the Centers for Disease Control and Prevention.
Other unhealthy behaviors may also help explain Indiana’s relatively low life expectancy at birth. The state’s adult smoking rate, for example, at 21.1%, is the 10th highest of all states.

40. Georgia
> Life expectancy at birth in 2015: 77.4 years
> Life expectancy at birth in 1980: 72.0 years (4th lowest)
> 1980-2015 life expectancy change: 5.4 years (13th largest)
Georgia residents have improved their lifestyle since 1980. The result has been the 13th largest increase in the state’s average life expectancy at birth. The state moved from having the fourth lowest life expectancy to 11th lowest of all states.
What is still holding Georgia back is its high poverty rate of 14.90% as well as the large share of residents who do not have health insurance of 13.40% — the fourth highest in the country. Working people with no health coverage have 40% higher mortality risk than those who have private insurance, according to research published in the American Journal of Public Health.
[in-text-ad]

39. Missouri
> Life expectancy at birth in 2015: 77.4 years
> Life expectancy at birth in 1980: 73.4 years (21st lowest)
> 1980-2015 life expectancy change: 4.01 years (16th smallest)
Missouri’s life expectancy at birth had improved compared to 1980, but their life expectancy rank has dropped over the same period from 21st to 11th lowest. Similar to other states where life expectancy has not improved much compared to other states, Missouri has a high share of residents with no health coverage and a high share of preventable hospitalizations.
Other contributing factors are likely the 22.15% adult smoking rate, the seventh highest in the country; the 25.80% share of adults who do not exercise, the 11th highest; and the 31.80% adult obesity rate, the 12th highest.
[recirclink id=488561]

38. Ohio
> Life expectancy at birth in 2015: 77.5 years
> Life expectancy at birth in 1980: 73.3 years (19th lowest)
> 1980-2015 life expectancy change: 4.2 years (18th smallest)
Ohio, the seventh most populous state in the country, has the sixth highest unemployment rate at 5.00%. The national jobless rate is 4.40%. People who do not have an income face many health challenges, including being more likely to develop a stress-related conditions, such as stroke, heart attack, heart disease, or arthritis. High unemployment in a single year will likely do little to affect the longevity of residents, but sustained joblessness could have an impact on life expectancy.
Georgians report feeling mentally unhealthy for 4.3 days a month, higher than the national average of of 3.8 mentally unhealthy days a month.

37. New Mexico
> Life expectancy at birth in 2015: 77.8 years
> Life expectancy at birth in 1980: 74.0 years (24th highest)
> 1980-2015 life expectancy change: 3.76 years (11th smallest)
New Mexico’s life expectancy rank compared to other states has significantly worsened since 1980, dropping 13 spots from 24th highest to 14th lowest. Lowering poverty can improve health outcomes. No state has a larger share of households living on less than $10,000 a year or using food stamps. New Mexico’s poverty rate of 19.70% is the second highest poverty rate in the country and compares to a national poverty rate of 13.40%.
Just 72.77% of diabetics in the Land of Enchantment test their blood sugar on regular basis, the lowest share and compares to national share of 85.00%. Both type 1 and type 2 diabetes have been linked to shorter life spans of about 11 and five years, respectively.
[in-text-ad-2]

36. North Carolina
> Life expectancy at birth in 2015: 77.9 years
> Life expectancy at birth in 1980: 72.8 years (10th lowest)
> 1980-2015 life expectancy change: 5.11 years (18th largest)
North Carolina’s relatively high poverty rate, uninsured rate, and share of households with an annual income of less than $10,000 are likely contributing to the state’s relatively low life expectancy at birth.
The life expectancy of residents varies with where in the state they live, according to research by NC Child, a nonprofit. People who are born today in Watauga County, which is not far from the northern border with Virginia, have a life expectancy of 82 years, compared to people born in Swain County, which is about 140 miles south, and who are expected to live 73 years.

35. Michigan
> Life expectancy at birth in 2015: 78.0 years
> Life expectancy at birth in 1980: 73.4 years (20th lowest)
> 1980-2015 life expectancy change: 4.6 years (24th smallest)
The differences in states life expectancy at birth are closely related to differences in socioeconomic and and health-related behaviors and outcomes, such as home values, the share of college educated adults, and smoking rate. In Michigan, the typical home value of $155,700 is well below the national median of $217,600. The percentage of Michigan adults with at least a bachelor’s degree of 29.1%, while high compared to other states with relatively short life expectancies, is below the national percentage of 32.0%. Approximately one in every five adults in the state smoke, among the highest proportions of all states.
[in-text-ad]

34. Nevada
> Life expectancy at birth in 2015: 78.1 years
> Life expectancy at birth in 1980: 72.7 years (7th lowest)
> 1980-2015 life expectancy change: 5.4 years (12th largest)
Nevada has one of the highest uninsured rates as well as one of the highest share of adults with no access to places for physical activity. The Sagebrush State also has among the lowest shares adult with a bachelor’s degree or higher.
Education contributes to more active communication, which, research has found to be crucial in health care. Better-educated people tend to ask more questions, have better ability to interpret medication labels, and are more likely to take medication properly.
[recirclink id=488514]

33. Alaska
> Life expectancy at birth in 2015: 78.1 years
> Life expectancy at birth in 1980: 72.5 years (6th lowest)
> 1980-2015 life expectancy change: 5.6 years (11th largest)
The increase in life expectancy at birth in Alaska since 1980 is among the highest in the country. Life expectancy has improved significantly especially in remote areas in Alaska due to better access to quality medical care and decreasing the rate of premature deaths.
Alaska has the third highest share of residents without health insurance. It also has the seventh highest share of preventable hospitalizations at 36.05 per 1,000 people.
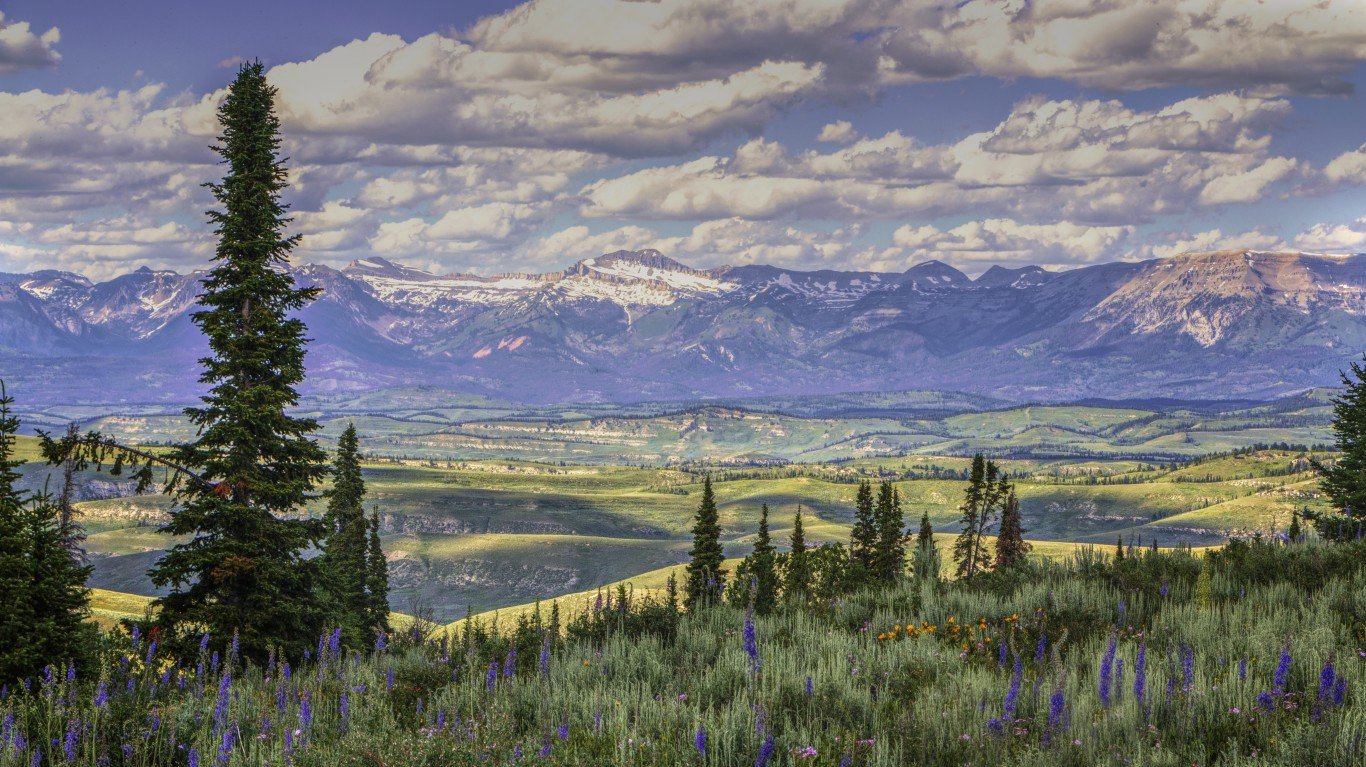
32. Wyoming
> Life expectancy at birth in 2015: 78.4 years
> Life expectancy at birth in 1980: 74.2 years (22nd highest)
> 1980-2015 life expectancy change: 4.2 years (19th smallest)
The least populous state in the country has the sixth highest percentage of residents who do not have health insurance coverage and the fifth highest injury mortality rate per 100,000 people, at 90.1, compared to a national average of 65.0. Wyoming is among the states with the lowest share of diabetics who check their blood pressure on a regular basis. For insulin-taking diabetics, self-monitoring blood sugar levels has been recognized as crucial for self-care because it can help keep glucose levels within an acceptable range.
[in-text-ad-2]

31. Texas
> Life expectancy at birth in 2015: 78.5 years
> Life expectancy at birth in 1980: 73.6 years (25th lowest)
> 1980-2015 life expectancy change: 4.9 years (23rd largest)
The second most populous state in the country has the highest share of the population with no health insurance, at 17.3%, compared to a national share of 8.7%. About 4.5 million Texas residents are uninsured, some 700,000 of them children. Lack of coverage has been linked to serious health problems such as such as higher prevalence of illnesses and injuries, chronic diseases, and higher mortality.

30. Pennsylvania
> Life expectancy at birth in 2015: 78.5 years
> Life expectancy at birth in 1980: 73.2 years (16th lowest)
> 1980-2015 life expectancy change: 5.3 years (16th largest)
About a fifth of adults do not engage in physical activity, which is about the national average. Lack of exercises has been consistently linked to poor physical health, which, research has found, is also associated with poor mental health. The number of both mentally and physically unhealthy days a month adults in the state reported of 4.3 and 3.9, respectively, is higher than the national average of 3.8 and 3.7, respectively.
[in-text-ad]

29. Kansas
> Life expectancy at birth in 2015: 78.5 years
> Life expectancy at birth in 1980: 75.1 years (10th highest)
> 1980-2015 life expectancy change: 3.4 years (8th smallest)
Kansas’ life expectancy at birth rank relative to other states has declined significantly since 1980, from 10th highest to 22nd lowest. What seems to be driving this change is the high obesity rate in the state. Some 32.4% of adults are obese, the eighth highest obesity rate of all states and higher than the national rate of 28.0%.
[recirclink id=488498]

28. Delaware
> Life expectancy at birth in 2015: 78.6 years
> Life expectancy at birth in 1980: 72.8 years (11th lowest)
> 1980-2015 life expectancy change: 5.8 years (8th largest)
Delaware is one of the 10 states with the largest share of households with an annual income of less than $10,000, adults who do not exercise, and driving deaths involving alcohol. The First State has a shortage of dentists. There are 49.1 dentists per 100,000 people, the third lowest concentration in the United States. Dentists can check for unhealthy teeth and gum disease, which some research suggests can even be an indication of heart problems. The concentration of primary care doctors is also below the nationwide average. There are 72.1 primary care doctors per 100,000 state residents, compared to 75.8 per 100,000 nationwide.

27. Montana
> Life expectancy at birth in 2015: 78.9 years
> Life expectancy at birth in 1980: 74.3 years (21st highest)
> 1980-2015 life expectancy change: 4.7 years (25th smallest)
Nearly half of of driving deaths in Montana involve alcohol, the second highest share of all states and well above the national share of 29.0%. The state also has the fourth highest injury mortality rate, at 91.3 per 100,000 people, compared to 65.0 per 100,000 nationwide. The premature age-adjusted mortality rate in Montana of 345.4 premature deaths per 100,000 people is also significantly higher than the national rate of 336.4 deaths under age 75 premature deaths per 100,000 people.
[in-text-ad-2]

26. Maine
> Life expectancy at birth in 2015: 79.0 years
> Life expectancy at birth in 1980: 74.5 years (19th highest)
> 1980-2015 life expectancy change: 4.5 years (22nd smallest)
Life expectancy in Maine has dropped from 79.3 years in 2014 to 79.0 years just a year later. Reducing drunk driving deaths may increase life expectancy as the state has the third highest percentage of driving deaths with alcohol involvement. In addition, a third of adult residents are obese, about the same as national obesity rate. And 20.5% of adults report excessive drinking, also above the 18.8% share nationwide.

25. South Dakota
> Life expectancy at birth in 2015: 79.1 years
> Life expectancy at birth in 1980: 74.9 years (13th highest)
> 1980-2015 life expectancy change: 4.2 years (20th smallest)
South Dakota’s life expectancy at birth rank compared to other states has significantly declined, from having the 13th highest life expectancy in 1980 to 23rd highest just 35 years later. Adults report the fewest mentally unhealthy days a month and among the fewest physically unhealthy days a month. The state also has the lowest share of adults who report being in poor health. What may be driving South Dakota’s life expectancy ranking lower, however, is the share of excessive drinking and the percentage of driving deaths involving alcohol. Some 20.2% of adults report excessive drinking compared to 18.0% nationwide, and 37.2% of driving deaths involve alcohol, the sixth highest share in the country.
[in-text-ad]

24. Idaho
> Life expectancy at birth in 2015: 79.1 years
> Life expectancy at birth in 1980: 75.2 years (7th highest)
> 1980-2015 life expectancy change: 3.89 years (13th smallest)
Idaho is another state where the life expectancy rank has dropped significantly since 1980, from the seventh highest to 24th highest. While the share of adults smoking, drinking excessively, and those who are obese is close to national averages, the share of state residents who lack health insurance coverage is higher than the national share. More than 10.1% of residents are uninsured compared to 8.7% of Americans nationwide.
[recirclink id=488094]

23. Illinois
> Life expectancy at birth in 2015: 79.1 years
> Life expectancy at birth in 1980: 73.3 years (18th lowest)
> 1980-2015 life expectancy change: 5.9 years (7th largest)
Illinois has improved its life expectancy standing over the last four decades due to a near 5.9 years increase in life expectancy — the seventh largest improvement in the country. The Prairie State has higher than average concentrations of primary care doctors and dentists per 100,000 residents, and a lower than the national average adult smoking rate. However, the share of adults drinking excessively is high (21.1%), as is the share of preventable hospitalizations (54.8 per 100,000 people) compared to the national figures of 18.0% and 49.0, respectively.

22. Virginia
> Life expectancy at birth in 2015: 79.2 years
> Life expectancy at birth in 1980: 73.1 years (15th lowest)
> 1980-2015 life expectancy change: 6.1 years (5th largest)
Compared to 1980, life expectancy at birth has risen in all states. The improvement in Virginia has been especially large. A typical Virginia newborn in 1980 was expected to live 73.1 years, the 15th lowest expectancy of states at that time. Today, the state’s life expectancy at birth of 79.2 years is in the higher half of states.
Virginia’s relatively long life expectancy at birth, while still lower than 21 states, is likely partly the result of high college attainment and high incomes, both factors shown to improve health and life expectancy in populations. Of adults in the state, 38.7% have at least a bachelor’s degree, the fifth largest percentage of all states. The typical household in the state has an annual income of $71, 535, the ninth highest income in the nation.
[in-text-ad-2]

21. Maryland
> Life expectancy at birth in 2015: 79.2 years
> Life expectancy at birth in 1980: 72.8 years (8th lowest)
> 1980-2015 life expectancy change: 6.45 years (4th largest)
Exposure to air pollution, lack of access to healthy food, lack of access to high quality (expensive) medical care, and a host of other health risk factors are more common in poorer areas. All of these are are associated with low life expectancy, and states with low incomes tend to have higher life expectancies. Maryland has the highest median household income of any state, at $80,776.
Life expectancy in Maryland has improved notably in recent decades. A typical Maryland newborn in 1980 was expected to live 72.8 years, in the bottom 10 of states at that time.
20. Nebraska
> Life expectancy at birth in 2015: 79.4 years
> Life expectancy at birth in 1980: 75.4 years (6th highest)
> 1980-2015 life expectancy change: 4.1 years (17th smallest)
Nebraska’s life expectancy at birth ranking over the last four decades has dropped significantly, from sixth highest in 1980 to 20th highest in 2015. Some 21.1% of state adult residents report excessive drinking, the fifth highest share of all states and higher than the national share. Similarly, the state’s adult obesity rate is higher than the national share. These factors might be contributing to the state’s decline in ranking.
[in-text-ad]

19. Arizona
> Life expectancy at birth in 2015: 79.5 years
> Life expectancy at birth in 1980: 74.1 years (23rd highest)
> 1980-2015 life expectancy change: 5.4 years (14th largest)
Unlike most states with higher-than-average life expectancy at birth, the poverty rate and uninsured rate in Arizona are relatively high. Nearly 15% of Arizonans live in poverty, and more than 10% do not have health insurance, each the 11th highest percentage of all states.
[recirclink id=488247]

18. Oregon
> Life expectancy at birth in 2015: 79.5 years
> Life expectancy at birth in 1980: 74.8 years (15th highest)
> 1980-2015 life expectancy change: 4.8 years (25th largest)
Just as lack of access to medical care can adversely affect life expectancy, a strong health system can help explain a relatively high life expectancy. For every 100,000 Oregon residents, there are 95 primary care physicians, 81 dentists, and 454 mental health providers — all in the top 10 compared to all states.

17. Wisconsin
> Life expectancy at birth in 2015: 79.5 years
> Life expectancy at birth in 1980: 75.2 years (9th highest)
> 1980-2015 life expectancy change: 4.3 years (21st smallest)
At 26.1%, no other state has a higher share of adults who drink excessively than Wisconsin. Defined as having at least five drinks during one occasion for men and four for women, excessive drinking has been linked to higher risk of heart disease, cancer, and mental health problems, all of which can lead to premature death. The state’s adult obesity rate of 30.6% is higher than the national rate of 28.0%.
[in-text-ad-2]

16. Iowa
> Life expectancy at birth in 2015: 79.5 years
> Life expectancy at birth in 1980: 75.7 years (5th highest)
> 1980-2015 life expectancy change: 3.8 years (12th smallest)
Iowa had one of the smallest life expectancies improvement between 1980 and 2015, and as a result, its ranking dropped, from fifth highest in 1980 to 16th highest in 2015. The Hawkeye State would likely benefit from a lower adult obesity rate as well as having adults exercise more and drink less. All three measures compare poorly relative to all states.

15. Florida
> Life expectancy at birth in 2015: 79.6 years
> Life expectancy at birth in 1980: 74.0 years (25th highest)
> 1980-2015 life expectancy change: 5.6 years (10th largest)
A person born in Florida in 2015 is expected to live 79.6 years, a full year longer than the average American newborn that year and the 15th highest life expectancy of all states. The state has also had one of the larger improvements in life expectancy, increasing by 5.6 years since 1980.
While socioeconomic factors like health insurance coverage rates and median household income frequently help explain differences in life expectancy, this is not always the case. In Florida, 12.9% of people are uninsured, unusually high for a state with a relatively long life expectancy at birth. Florida’s median annual household income of $52,594 is also exceptionally low for the state’s position in this ranking. The state’s low income is likely high due to the high share of retirees residing in the state.
[in-text-ad]

14. Rhode Island
> Life expectancy at birth in 2015: 79.6 years
> Life expectancy at birth in 1980: 74.7 years (17th highest)
> 1980-2015 life expectancy change: 4.9 years (22nd largest)
The smallest state by area has the fourth largest concentration of primary care doctors and the sixth largest concentration of mental health providers per 100,000 people. The state’s adult smoking and obesity rates are slightly below the national rates of 28.0% and 18.0%, respectively.
[recirclink id=488174]

13. Utah
> Life expectancy at birth in 2015: 79.6 years
> Life expectancy at birth in 1980: 75.9 years (3rd highest)
> 1980-2015 life expectancy change: 3.7 years (10th smallest)
Despite declining in ranking for life expectancy of states since 1980, Utah has remained among the states with a higher life expectancy. Utah has a relatively low adult obesity and physical inactivity rates — with a number of national parks and monuments in the state it is hard to stay inside. These factors may explain why Utah is still in the top 15. What could be contributing to its decline in ranking however, is the state’s fairly large share of uninsured people, which at 9.2% is the 15th highest of all states. People with no health insurance coverage have worse access to health care due to high cost and are less likely to receive care.

12. North Dakota
> Life expectancy at birth in 2015: 79.8 years
> Life expectancy at birth in 1980: 75.8 years (4th highest)
> 1980-2015 life expectancy change: 4.0 years (14th smallest)
Despite still ranking among the 15 states with the highest life expectancy, South Dakota used to rank even higher. Several factors might be contributing to the Peace Garden State’s drop in ranking. Some 31.8% of state adults are obese, higher than the 28.0% nationwide, and the state has the second highest share of adults who report excessive drinking. Further, 48.1% of car accident deaths in the state involve alcohol, the highest share of all states.
[in-text-ad-2]

11. Vermont
> Life expectancy at birth in 2015: 79.9 years
> Life expectancy at birth in 1980: 74.5 years (18th highest)
> 1980-2015 life expectancy change: 5.4 years (14th largest)
Good access to health services across a population often translates to better health outcomes because of the better odds of treating chronic health issues and of catching serious health problems early. No state has more primary care physicians per capita than Vermont, where for every 100,000 people there are 112.4 doctors serving communities. The concentration of mental health providers, at 407.2 per 100,000, is fourth highest of all states.
Vermont’s life expectancy at birth in 1980 was higher than most other states. Since then it has improved faster than most states, rising by 5.4 years.

10. New Hampshire
> Life expectancy at birth in 2015: 79.9 years
> Life expectancy at birth in 1980: 74.9 years (12th highest)
> 1980-2015 life expectancy change: 5.0 years (21st largest)
Life expectancy in New Hampshire has continued to be among the highest over the years. Two reasons may help explain the consistent relatively high expectancy: relatively high educational attainment and low poverty, both of which have been linked to better overall health and longer life expectancy. No other state has a lower poverty rate, and only one has a lower share of households with an annual income of $10,000 or less. The Granite State has the eighth highest share of adults with a bachelor’s degree or higher.
[in-text-ad]

9. Washington
> Life expectancy at birth in 2015: 80.2 years
> Life expectancy at birth in 1980: 75.1 years (10th highest)
> 1980-2015 life expectancy change: 5.1 years (17th largest)
Washington state has had among the longer life expectancies of all states over the last four decades. One possible reason may be the high share of the population who engage in physical activity. Only 17.1% do not exercise, the third lowest percentage, compared to 23.0% nationwide. The Evergreen State is also among those with the highest concentration of primary care doctors, dentists, and health care providers per 100,000 residents.
[recirclink id=487977]

8. Colorado
> Life expectancy at birth in 2015: 80.2 years
> Life expectancy at birth in 1980: 75.2 years (8th highest)
> 1980-2015 life expectancy change: 5.0 years (19th largest)
Colorado’s average life expectancy at birth has remained eighth highest since 1980. The Centennial State has the lowest adult obesity rate in the country. In terms of overall health measures, Colorado has among the lowest shares of obesity, cancer deaths, and children living in poverty.

7. New Jersey
> Life expectancy at birth in 2015: 80.2 years
> Life expectancy at birth in 1980: 73.5 years (22nd lowest)
> 1980-2015 life expectancy change: 6.7 years (2nd largest)
New Jersey’s life expectancy at birth has significantly improved over the last four decades, more so than other states. As a result, its ranking improved from having the 22nd lowest life expectancy in 1980 to seventh highest in 2015. The Garden States has among the highest education attainment rates and household incomes of all states, and among the lowest poverty rates. These factors may have contributed to the state’s 6.7 year increase in life expectancy, the second largest of all states.
[in-text-ad-2]

6. Massachusetts
> Life expectancy at birth in 2015: 80.4 years
> Life expectancy at birth in 1980: 74.7 years (16th highest)
> 1980-2015 life expectancy change: 5.7 years (9th largest)
Massachusetts has significantly improved its standing when it comes to life expectancy, jumping 10 spots since 1980. One factor that may help explain this jump is health insurance coverage. No state has a lower share of uninsured residents. Other contributing factors may be the state’s fourth lowest adult obesity rate. In addition, the Bay State has the highest concentration of mental health providers and dentists per capita, and the third highest concentration of primary care physicians.

5. New York
> Life expectancy at birth in 2015: 80.5 years
> Life expectancy at birth in 1980: 73.2 years (17th lowest)
> 1980-2015 life expectancy change: 7.3 years (the largest)
As is often the case in states with high life expectancies, measures such as New York’s relatively low obesity rate and high college attainment rate reflect healthy lifestyles and advantages that support longer lives. One in four state adults are obese, versus approximately one in three adults nationwide. The percentage of adults with at least a bachelor’s degree of 36% is 10th highest of all states.
New York’s life expectancy at birth rose by over seven years between 1980 and 2015, the largest improvement in the nation. To the extent that economic status relates to life expectancy, however, the gains in life expectancy are not enjoyed equally across the state. New York is the nation’s most unequal state, with incomes at the 20th percentile nearly six times greater than the incomes at the 80th.
[in-text-ad]

4. Connecticut
> Life expectancy at birth in 2015: 80.8 years
> Life expectancy at birth in 1980: 74.9 years (14th highest)
> 1980-2015 life expectancy change: 6.0 years (6th largest)
Connecticut has the highest concentration of primary doctors, dentists, and mental health providers per 100,000 people. The state has fourth lowest adult smoking rate as well as among the lowest shares of adults who report being in poor health.
[recirclink id=487572]
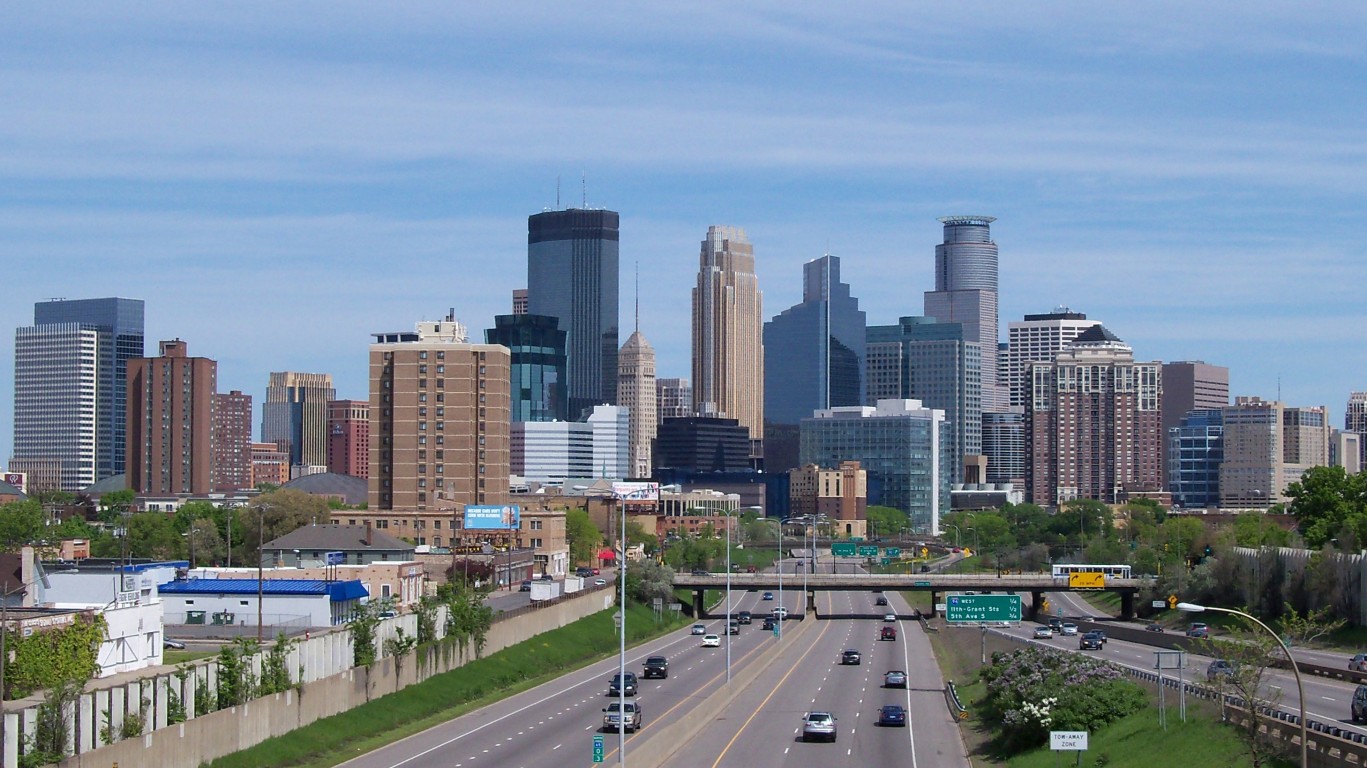
3. Minnesota
> Life expectancy at birth in 2015: 80.8 years
> Life expectancy at birth in 1980: 76.0 years (2nd highest)
> 1980-2015 life expectancy change: 4.8 years (24th largest)
Minnesota has been in the top three states for life expectancy since at least the 1980s. Socioeconomic factors, such as the fourth lowest poverty rate in the country and the lowest share of households living on less than $10,000 a year, may help explain this. The state also has the third lowest share of uninsured people, at only 4.4% compared to a national share of 8.7%.

2. California
> Life expectancy at birth in 2015: 80.9 years
> Life expectancy at birth in 1980: 74.3 years (20th highest)
> 1980-2015 life expectancy change: 6.6 years (3rd largest)
Residents of California have significantly improved their lifestyle, improving average life expectancy in the state significantly, and jumping from the 20th position in 1980 to second in 2015. The Golden State has the third lowest share of obese adults, the fifth lowest share of adults who do not exercise, and the second lowest share of adults who smoke. Also, 268.8 people under age 75 die per 100,000 people every year, the third lowest premature mortality rate and well below the national rate of 336.4 per 100,000.
[in-text-ad-2]

1. Hawaii
> Life expectancy at birth in 2015: 81.3 years
> Life expectancy at birth in 1980: 76.8 years (the highest)
> 1980-2015 life expectancy change: 4.5 years (23rd smallest)
Hawaii continues to be the state with the longest life expectancy year after year. The Aloha State has the second lowest obesity rate in the country, the third lowest smoking rate, and the among the primary care doctors and dentists per capita.
The state has the second lowest share of residents with no health insurance, which may explain why are only 23.3 preventable hospitalizations per 100,000 people, the lowest preventable hospitalization of all states.
Detailed Findings
Higher incomes are closely associated with longer life expectancy. The difference in life expectancy at the age of 40 for Americans in the richest 1% and the poorest 1% is 15 years for men and 10 years for women, according to a 2016 research published in the Journal of the American Medical Association.
Of the 23 states with a shorter life expectancy (at birth) that the average nationwide 17 have poverty rates that exceed that national rate of 13.4%. The opposite is generally the case across states with above-average life expectancies.
Exposure to air pollution, a general lack of access to health care, unhealthy behaviors, lack of access to healthy food, and other health risk factors — which are all more common in poorer areas — also contribute to lower life expectancies in some parts of the country.
Unhealthy behaviors such as smoking and physical inactivity can also help explain an area’s life expectancy. All but three of the 23 states with life expectancies at or below the national average report a higher adult smoking rate than the 17.0% national rate. Of the states with longer life expectancies, only seven report smoking rates that exceed the national rate.
Methodology
To determine the states with the longest and shortest life expectancy, 24/7 Wall St. reviewed 2010-2015 life expectancy at birth figures obtained from the National Association for Public Health Statistics and Information Systems (NAPHSIS) and the Robert Wood Johnson Foundation (RWJF). Figures for life expectancy at birth in 1980 came from the Institute for Health Metrics and Evaluation. Data on smoking, excessive drinking, and obesity rates came from County Health Rankings & Roadmaps program, a collaboration between RWJF and the University of Wisconsin Population Health Institute. Data on the 2017 income and poverty rates came from the U.S. Census Bureau. All data are for the most recent period available.
Contact [email protected] for any questions or corrections.