Based on voting data compiled by political news organization Politico, 24/7 Wall St. measured the political leanings of county residents. Several measures were used to identify the most Republican-leaning county in each state: The percentage of county residents voting for Republican candidate Mitt Romney in 2012 and the county’s chosen representatives to the House and the Senate.. These are the reddest (and bluest) counties in each state.
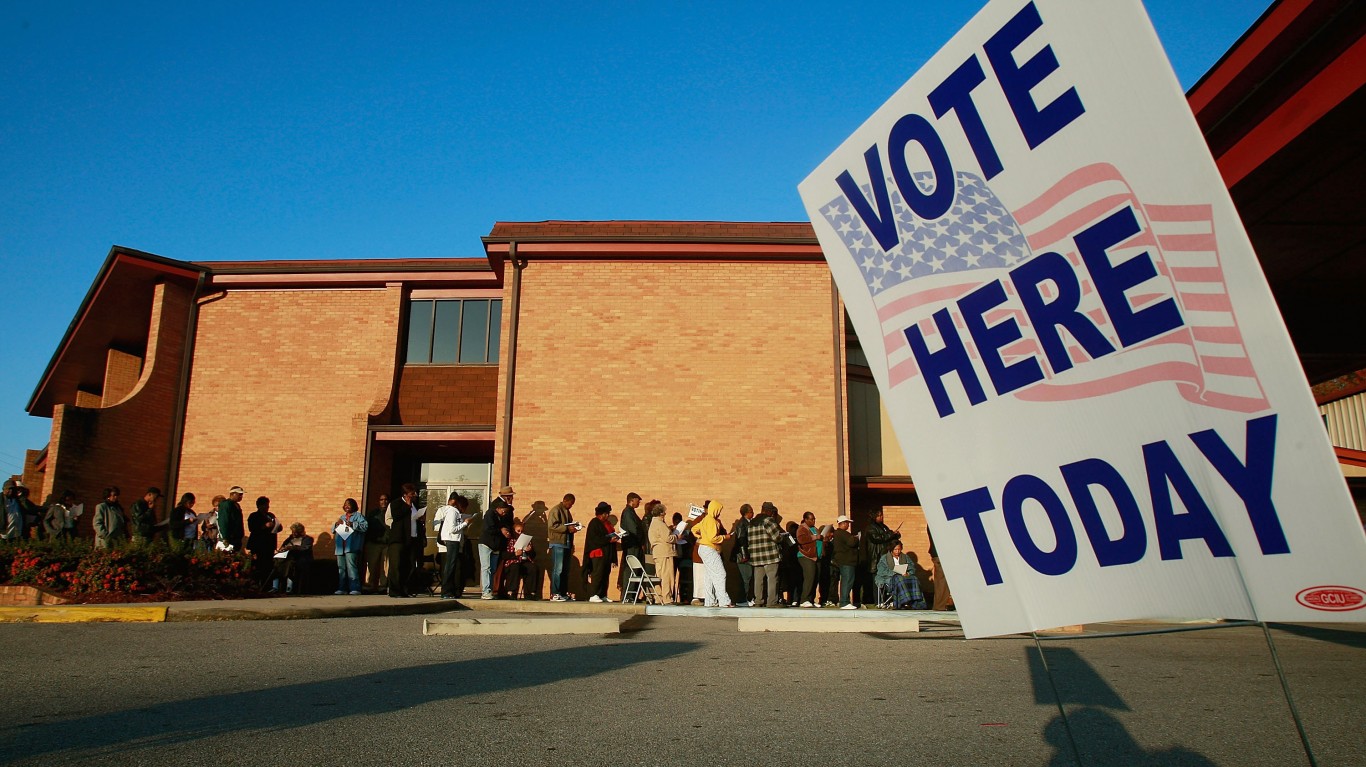
Click here to see the most Republican county in each state.
Click here to see the most Democratic county in each state.
In general, people living in the reddest counties tended to be better-off financially compared to democratic-leaning areas. The reddest counties in 29 states had a median household income greater than the comparable national income of $53,046. By contrast, the median household income was higher than the national figure in only 18 of the 50 bluest counties.
While counties dominated by Republicans tended to be wealthier, residents in these areas also tended to have lower educational attainment rates compared to the bluest counties. In the five years through 2013, the percentage of adults who had attained at least a bachelor’s degree was lower than the comparable national rate of 28.8% in 36 of the 50 reddest counties. This was the case in just 17 of the bluest counties.
The racial composition of Republican-leaning counties was also significant. The vast majority of residents in most of the reddest counties identify as white. The proportions of the white populations in only two of the reddest counties were lower than the 74% of Americans who identify as white. On the other hand, 33 of the bluest counties had smaller shares of white populations compared to the national average composition.
The reddest counties almost always had the highest share of votes for the Republican presidential candidate compared to other counties in the state, and those shares were almost always a majority. However in five of the reddest counties — Honolulu county, Hawaii; Lincoln County, Maine; Plymouth County, Massachusetts; Washington County Rhode Island; and Essex County, Vermont — a majority of residents in voted to re-elect President Obama. In these counties, Romney still captured among the largest shares of votes compared to other counties in the state.
However, some of the reddest counties are not as red as those in other states. Carroll County, Maryland, for example, has sent Democratic Rep. Chris Van Hollen to Congress since 2002 yet in 2012 gave 65.7% of its vote to Romney. Rep. Collin Peterson (D-MN) was first elected to Congress from Pipestone County, Minnesota in 1990 and re-elected every two years since, but that county gave 61% of its presidential vote to Romney.
To identify the most Republican county in each state, 24/7 Wall St. reviewed the percentage of eligible counties casting votes for Mitt Romney in 2012 from Politico, a political news organization. Eligible counties were those that cast more than 2,000 total votes. Additionally, we created an index of each county’s Congressional representation in both the House of Representatives and the Senate since 2007. The highest values of our index were given to counties where Congressional representation was dominated by Republicans. The reddest county in each state is the product of our Congressional index and the share of a county’s votes cast for Mitt Romney. We also reviewed the percentage of county residents who had attained at least a bachelor’s degree, median household incomes, and the share of residents identifying as white — all from the U.S. Census Bureau’s 2013 American Community Survey five-year estimates.
The Most Republican Counties
Alabama
More than 86% of Blount County residents who cast a ballot in the 2012 presidential elections voted for Romney, the largest share of any county in Alabama. About 15.8% of county residents lived in poverty from 2009 through 2013, just higher than the national poverty rate of 15.4%. Additionally, the county was predominantly white, with 95.3% of its 57,623 residents identifying solely as white. Blount County residents were also relatively poorly educated as only 12.1% of adult residents had at least a bachelor’s degree, far below the comparable national figure of 28.8%. The county has consistently elected Republicans to the House of Representatives just as Alabama has consistently sent Republicans to the U.S. Senate.
Alaska
No data available
ALSO READ: The Richest Town in Each State
Arizona
Some 55.1% of Maricopa County’s 2012 votes went to Romney. About 16.7% of county residents lived in poverty from 2009 through 2013, higher than the national poverty rate of 15.4% over the same period. Additionally, the county was predominantly white, with 80.7% of its 3,889,161 residents identifying solely as white. Unlike most predominantly Republican counties, Maricopa County residents were relatively well educated. An average of 29.8% of county residents had at least a bachelor’s degree over the five years through 2013, slightly higher than the national rate of 28.8%.
Arkansas
Romney won 73.6% of the 2012 votes cast in Crawford County. The county’s poverty rate of 20.2% from 2009 through 2013 was much higher than the national rate of 15.4% over the same period. As in the reddest county in many other states, Crawford county was also predominantly white, with 91.1% of its 61,796 residents identifying solely as white. Crawford County residents were relatively poorly educated as only 14.3% of county residents had at least a bachelor’s degree, about half the comparable national figure. Current presidential candidate Mike Huckabee is from Arkansas. He served as the state’s governor from 1996 to 2007.
ALSO READ: The Happiest (and Most Miserable) Cities in America
California
The most Republican county in California is Placer County, where Romney won 58.9% of the 2012 vote. Relatively fewer people in the county lived in poverty from 2009 through 2013 than across the nation. More than 84% of the county’s 355,924 residents identified solely as white, higher than the 74% of all Americans who identify as white. Like most predominantly Republican counties, Placer County residents were relatively wealthy. In the five years through 2013, median household income was $72,725, more than $18,000 higher than the national figure of $53,046. Former Hewlett-Packard CEO Carly Fiorina, who unsuccessfully ran for Senate in California, announced her candidacy for president in May.
Colorado
Romney won 65.1% of the 2012 votes cast in Teller County. The county’s poverty rate was lower than the national rate from 2009 through 2013. Additionally, the county was predominantly white, with 94.3% of its 23,276 residents identifying solely as white. Unlike most predominantly Republican counties, Teller County residents were relatively well educated. About 31.6% of county residents had at least a bachelor’s degree over the five years through 2013, compared with 28.8% of all adults nationally.
Connecticut
Some 51.1% of the Litchfield County 2012 votes went for Romney, the largest share of any county in Connecticut. The county was predominantly white, with 94% of its 188,629 residents identifying solely as white. County residents were also quite wealthy, with a typical household making more than $71,000 in the five years through 2013. For comparison, the national household income over that period was $52,046.
ALSO READ: The Healthiest (and Least Healthy) Countries in the World
Delaware
Sussex is the most Republican county in Delaware, with residents casting 55.9% of their votes for Republican candidate Romney. Unlike other Republican counties, relatively few Sussex County residents were poor. In the five years through 2013, only 13.4% of residents lived in poverty, compared to 15.4% nationally.
Florida
Romney won 83.6% of the 2012 votes cast in Holmes County. About 23.8% of county residents lived in poverty from 2009 through 2013, much higher than the national poverty rate of 15.4% over the same period. Additionally, the county was predominantly white, with more than nine in 10 residents identifying solely as white. Holmes County residents were also poorly educated, with only 12% of residents attaining at least a bachelor’s degree, far below the comparable national figure of 28.8%. State Republicans will likely see a familiar face in the next election cycle. Former Florida Governor Jeb Bush announced his candidacy for the Republican presidential nomination at the beginning of June. Current Florida Senator Marco Rubio also announced his candidacy.
ALSO READ: 9 Cities Running Out of Water
Georgia
Romney won 86.5% of the Banks County 2012 vote, the largest share of any county in Georgia. About 16.7% of county residents lived in poverty from 2009 through 2013, higher than the national poverty rate of 15.4% over the same period. Additionally, the county was predominantly white, with 93.3% of its 18,333 residents identifying solely as white. Banks County residents were also poorly educated. Only 11.6% of county residents had at least a bachelor’s degree, significantly below the comparable national figure of 28.8%.
Hawaii
Honolulu County is the most Republican county in Hawaii, despite casting the majority of its votes for Democratic candidate Obama. Less than 30% of eligible residents voted for Romney, but this percentage was higher than in every other county in the state. In the five years prior to 2013, 32.1% of county residents had at least a bachelor’s degree, higher than the comparable national figure of 28.8%.
ALSO READ: America’s Fastest Shrinking Cities
Idaho
Some 93.3% of Madison County residents who cast a ballot in the 2012 presidential elections voted for Romney, the largest share of any county in Idaho and of any county in the country. About 35.8% of county residents lived in poverty from 2009 through 2013, more than double the national poverty rate of 15.4% over the same period. The county’s population is also nearly exclusively white, with 95.2% of its 37,542 residents identifying solely as white. Unlike most predominantly Republican counties, Madison County residents were relatively well educated. In the five years prior to 2013, 33.7% of county residents had at least a bachelor’s degree compared with 28.8% of all adults nationwide.
Illinois
Romney won 78.0% of the 2012 votes cast in Wayne County. The county’s poverty rate from 2009 through 2013 was lower than the national rate over that time. Additionally, the county was predominantly white, with 98.1% of its 16,674 residents identifying solely as white. Only 11.8% of residents had at least a bachelor’s degree, far below the comparable national figure of 28.8%.
ALSO READ: America’s Fastest Growing Cities
Indiana
Kosciusko County is the most Republican county in Indiana, with Romney winning more than three-quarters of the 2012 vote. Relatively fewer people in the county lived in poverty from 2009 through 2013 than across the nation. Additionally, 93% of the county’s 77,527 residents identified solely as white. Kosciusko County residents, like their statewide peers, were also relatively poorly educated. Only 20.3% of county residents had at least a bachelor’s degree, well below the comparable national figure of 28.8%.
Iowa
Romney won 83.6% of the Sioux County vote in 2012. The county’s poverty rate from 2009 through 2013 was lower than the national rate. Additionally, 93.5% of its 34,050 residents identified themselves solely as white. Sioux County residents were also relatively poorly educated. Some 23.4% of residents had at least a bachelor’s degree, below the comparable national figure of 28.8%.
Kansas
Some 84.3% of Scott County residents who cast a ballot in the 2012 presidential elections voted for Romney, the largest share of any county in Kansas. Relatively fewer county residents lived in poverty than across the nation from 2009 through 2013. Additionally, as in many of the reddest counties in each state, more than 95% of the county’s 4,930 residents identified solely as white. Also, some 23.4% of residents had at least a bachelor’s degree, below the state educational attainment rate of 30.3%.
ALSO READ: Eight Housing Markets With the Longest Road to Recovery
Kentucky
Leslie County is the most Republican county in Kentucky with Romney winning 89.7% of its 2012 vote. About 22.6% of county residents lived in poverty from 2009 through 2013, much higher than the national poverty rate of 15.4% over the same period. Additionally, nearly all of the 11,220 residents identified had as white. Leslie County residents also had low college-attainment rates. Only 7.3% of residents had at least a bachelor’s degree from 2009 through 2013, nearly a quarter of the comparable national rate of 28.8%. Libertarian favorite and Kentucky Senator Rand Paul will add his name to the growing list of Republican candidates vying for the presidential nomination in next year’s primary election.
Louisiana
Romney won 81.7% of the 2012 votes cast in Grant Parish. About 17.3% of parish residents lived in poverty from 2009 through 2013, higher than the national poverty rate of 15.4% over the same period. The county was also predominantly white, with 80.1% of its 22,113 residents identifying solely as white. Grant Parish residents were also relatively poorly educated. Only 10.2% of residents had at least a bachelor’s degree, about half the statewide rate, which was itself much lower than the comparable national rate of 28.8%. Louisiana Governor Bobby Jindal announced he is running for president this June.
ALSO READ: The Most Iconic Job in Each State
Maine
Lincoln is the most Republican county in Maine. While the majority of the county’s votes went for Democratic candidate Obama, Romney’s 43% share was the highest compared to other counties in Maine. With Democrat supporters generally more educated, it’s not surprising the generally Democratic county was also relatively better educated. In the five years through 2013, 33.1% of residents had at least a bachelor’s degree, higher than the comparable national figure of 28.8%. Lincoln County is represented in Congress by Democrat Chellie Pingree, who was first elected in 2008. The senators from Maine are Republican Susan Collins and independent Angus King. King is one of two independents in the Senate, joining Bernie Sanders of Vermont.
Maryland
Some 65.7% of Carroll County residents who cast ballots in 2012 voted for Romney, the largest share of any county in Maryland. Relatively fewer people in the county lived in poverty from 2009 through 2013 than across the nation. The county was overwhelmingly white, with 92.8% of its 167,261 residents identifying solely as white. Unlike most predominantly Republican counties, but like their statewide peers, county residents were relatively well educated. About 32.7% of residents had at least a bachelor’s degree over the five years ending 2013 compared with 28.8% of all adults nationwide. Despite its status as the reddest county in Maryland, Carroll County residents have consistently elected and re-elected Democrats to both the House of Representatives and the Senate. In addition to former Governor Martin O’Malley, who recently announced his candidacy for the Democratic presidential nomination, another Maryland native may be on the ballot. Ben Carson, a retired neurosurgeon, will campaign for the Republican ticket.
Massachusetts
Despite casting the majority of its votes for Democratic candidate Obama, Plymouth County is the most Republican county in Massachusetts. Romney won 47.5% of the vote in the county. In the five years through 2013, more than 33% of residents had at least a bachelor’s degree, higher than the comparable national figure of 28.8%. Plymouth County was represented in Congress by Democrat Barney Frank until his retirement. Democrat Joseph Kennedy III was elected to succeed him.
ALSO READ: The Best and Worst States to Be Unemployed
Michigan
Romney won 66.7% of the Ottawa County 2012 vote, the largest share of any county in Michigan, the state in which Romney was born. Relatively fewer people in the county lived in poverty from 2009 through 2013 than across the nation. In addition, nearly 90% of the county’s 267,017 residents identified solely as white. Unlike most predominantly Republican counties, more than 30% of residents had at least a bachelor’s degree over the five years through 2013.
Minnesota
Romney won 61% of the 2012 votes cast in Pipestone County. The county had a lower poverty rate from 2009 through 2013 than the national rate. Additionally, the county was predominantly white, with 93.5% of its 9,470 residents identifying solely as white. Pipestone County residents were also relatively poorly educated. While 32.6% of adults statewide were college-educated, only 16.8% of county residents had at least a bachelor’s degree, also well below the comparable national rate of 28.8%.
ALSO READ: States Volunteering the Most (and Least)
Mississippi
Rankin County is the most Republican county in Mississippi, with Romney winning 75.4% of the county’s 2012 vote. From 2009 through 2013, 11.5% of county residents lived in poverty, nearly half the nation-leading comparable state poverty rate of 22.7%. Republican Gregg Harper currently represents the county in the House of Representatives.
Missouri
Some 75.1% of Bollinger County voters cast their ballots in 2012 for Romney. About 19.9% of county residents lived in poverty from 2009 through 2013, well above the national poverty rate of 15.4% over the same period. The county’s population was almost exclusively white, with 98% of its 12,408 residents identifying solely as white. Bollinger County residents were also poorly educated. Only 10.9% of residents had at least a bachelor’s degree, considerably lower than the comparable national rate of 28.8%.
Montana
Musselshell is the most Republican county in Montana. In the 2012 Presidential election, residents cast 76.2% of their votes for Romney. Unlike some other Republican-dominated counties, Musselshell residents were not especially wealthy. In the five years through 2013, median household income was just $43,409, almost $10,000 below the national figure.
Nebraska
Romney won 83.8% of the 2012 votes cast in Cherry County. Relatively fewer people in the county lived in poverty from 2009 through 2013 than across the nation. Additionally, the county was predominantly white, with 89.6% of its 5,735 residents identifying solely as white. Cherry County residents were also relatively poorly educated. Only 21.3% of residents had at least a bachelor’s degree, well below the comparable national figure of 28.8%.
ALSO READ: States With the Strongest and Weakest Unions
Nevada
The most Republican county in Nevada is Elko County, where Romney won 75.2% of the 2012 vote. The county’s poverty rate from 2009 through 2013 was lower than the national rate over that time. As in many other predominantly Republican counties, more than 88% of Elko County’s 50,023 residents identified solely as white. Also, only 16.4% of county residents had at least a bachelor’s degree, far below the comparable national figure of 28.8%.
New Hampshire
Belknap County cast 52% of its 2012 vote for Romney. Relatively fewer people in Belknap lived in poverty from 2009 through 2013 than across the nation. Additionally, the county was overwhelmingly white, with 96.3% of its 60,216 residents identifying solely as white.
ALSO READ: Companies Profiting from War
New Jersey
Sussex County is the most Republican county in New Jersey, with Romney winning 60.3% of the county’s 2012 vote. Relatively fewer people in the county lived in poverty from 2009 through 2013 than across the nation. Additionally, nearly 94% of the county’s 147,924 residents identified solely as white. Unlike most predominantly Republican counties, Sussex County residents were relatively well educated. Some 32.4% of residents had attained at least a bachelor’s degree over the five years through 2013, higher than the national rate of 28.8% nationally.
New Mexico
Romney won 68% of the 2012 votes cast in Curry County. About 18.9% of county residents lived in poverty from 2009 through 2013, higher than the national poverty rate of 15.4% over the same period. While the Republican base is overwhelmingly white Romney won Curry despite a relatively low 71.7% of its 49,302 residents identifying as white. The county has consistently elected a Democrat to the House of Representatives. Since 2008, both of New Mexico’s U.S. senators have been Democrats.
New York
Some 54.9% of Putnam County residents who cast a ballot in 2012 voted for Romney, the largest share of any county in New York. Relatively fewer people in the county lived in poverty from 2009 through 2013 than across the nation. The county was predominantly white, with 89.6% of its 99,718 residents identifying solely as white. Unlike most predominantly Republican counties, Putnam County residents were relatively well educated. About 38% of residents had at least a bachelor’s degree over the five years through 2013, well above the national rate of 28.8% for all adults.
ALSO READ: 15 Cities With the Most High-Tech Jobs
North Carolina
Yadkin County is the most Republican county in North Carolina with 75% of the 2012 votes cast for Romney. About 18.5% of Yadkin residents lived in poverty from 2009 through 2013, higher than the national poverty rate of 15.4% over the same period. The county was also overwhelmingly white, with 90.7% of its 38,217 residents identifying solely as white. Yadkin residents were also poorly educated compared to most Americans. Only 13.1% of residents had at least a bachelor’s degree, less than half the comparable national figure of 28.8%.
North Dakota
Dunn is the most Republican county in North Dakota, casting 74.6% of its votes for Republican candidate Romney. From 2009 through 2013, only one-in-10 county residents lived in poverty, lower than the national rate of 15.5%. Additionally, 84.6% of county residents identified solely as white.
ALSO READ: America’s Least Healthy Fast-Food Chains
Ohio
Romney won 76.6% of the Mercer County vote cast in the 2012 presidential elections. Relatively fewer people in the county lived in poverty from 2009 through 2013 than across the nation. As in many Republican-leaning counties, Mercer’s population was nearly exclusively white, with 97.6% of its 40,811 residents identifying solely as white. In addition, only 16.2% of Mercer residents had at least a bachelor’s degree, well below the comparable national figure of 28.8%.
Oklahoma
In Beaver County, Romney won 89.4% of the votes cast in the 2012 presidential elections, the largest share of any county in Oklahoma. Relatively fewer people in the county lived in poverty from 2009 through 2013 than across the nation. Additionally, the county was predominantly white, with 86.8% of its 5,605 residents identifying solely as white. Beaver County residents were also poorly educated. Only 17.9% of residents had at least a bachelor’s degree, well below the comparable national figure of 28.8%.
Oregon
The most Republican county in Oregon is Lake County, where Romney won 76.2% of the 2012 vote. About 20.1% of county residents lived in poverty from 2009 through 2013, much higher than the national poverty rate of 15.4% over the same period. Additionally, 89.7% of its 7,862 residents identified solely as white. Lake County residents were also relatively poorly educated. Only 18.6% of area adults had at least a bachelor’s degree, far below the comparable national figure of 28.8%.
ALSO READ: States With the Highest Gas Prices
Pennsylvania
Fulton County cast 77.7% of its 2012 vote for Romney. Relatively fewer people in the county lived in poverty from 2009 through 2013 than across the nation. Additionally, the county was overwhelmingly white, with 97.4% of its 14,779 residents identifying solely as white. Fulton County residents were also quite poorly educated. Only 11.8% of residents had at least a bachelor’s degree, significantly below the comparable national figure of 28.8%. Rick Santorum, who ran unsuccessfully for president in 2012, will seek the Republican presidential nomination again this election cycle. Previously, Santorum served as a senator from Pennsylvania.
Rhode Island
Washington is the most Republican county in Rhode Island. Romney captured 40.5% of the county vote, more than in every other county in Rhode Island. While the majority of the county’s votes were for Democratic candidate Obama, Washington County has consistently elected Democrats to both the House of Representatives and the Senate. In the five years prior to 2013, more than 43% of residents had at least a bachelor’s degree, significantly higher than the comparable national figure of 28.8%.
ALSO READ: The Best (and Worst) Paying Cities for Women
South Carolina
Romney won 73.5% of the 2012 votes cast in Pickens County, the largest share of any county in South Carolina. About 18.9% of county residents lived in poverty from 2009 through 2013, higher than the national poverty rate of 15.4% over the same period. Additionally, the county was predominantly white, with 88.7% of its 119,483 residents identifying solely as white. Pickens County residents were also relatively poorly educated. Only 23% of residents had at least a bachelor’s degree, below the comparable national rate of 28.8%. South Carolina native and current U.S. Senator Lindsey Graham will vie for the Republican presidential nomination in next year’s primary election.
South Dakota
Butte is the most Republican county in South Dakota, with Romney capturing 73% of the county’s votes in 2012. The poverty rate in Butte County was 10.2% from 2009 through 2013, far lower than the rate across the country. Like most of the county’s population, South Dakota senators Mike Rounds and John Thune are Republicans.
Tennessee
Some 77.5% of Wayne County residents who cast a ballot in the 2012 presidential elections voted for Romney, the largest share of any county in Tennessee. About 20.2% of county residents lived in poverty from 2009 through 2013, much higher than the national poverty rate of 15.4% over the same period. In addition, county residents identifying as white accounted for 92.2% of the 16,996 people living in the county. Wayne County residents were also quite poorly educated. Only 7.9% of residents had at least a bachelor’s degree, less than a third of the comparable state figure of 23.8%, which was itself far lower than the national rate of 28.8%.
ALSO READ: The Poorest Town in Each State
Texas
Ochiltree County cast 90.9% of its 2012 vote for Romney, the largest share of any county in Texas. About 17.3% of county residents lived in poverty from 2009 through 2013, in line with the state’s poverty rate and higher than the national poverty rate of 15.4% over the same period. The county was predominantly white, with 80.5% of its 10,467 residents identifying solely as white. Ochiltree County residents were also relatively poorly educated. Only 15.3% of residents had at least a bachelor’s degree, far below the comparable national figure of 28.8%. Few state voters have the chance to vote for a candidate native to their state. In Texas, however, Republicans will have to select between two — Senator Ted Cruz and former Governor Rick Perry — in the Republican primary next year.
Utah
Uintah County is the most Republican county in Utah, with 90% of its 2012 vote cast for Romney. Relatively fewer people in the county lived in poverty from 2009 through 2013 than across the nation. Additionally, the county was predominantly white, with 85.6% of its 33,722 residents identifying solely as white. Relatively few Uintah County residents had a college education. Only 16.2% of residents had at least a bachelor’s degree, far below the comparable national figure of 28.8%.
ALSO READ: Cities With the Highest (and Lowest) Unemployment
Vermont
Essex is the most Republican county in Vermont, with 42.2% of eligible Vermonters voting for Romney. Like the state as a whole, the majority of the county’s votes were for Democratic candidate Obama. Democrat-leaning Americans tended to have higher educational attainment rates. In the five years through 2013, more than 14.7% of residents had at least a bachelor’s degree, higher than the comparable national figure of 28.8%.
Virginia
Romney won 72.4% of the votes cast in Powhatan County in the 2012 elections. From 2009 through 2013, just 5.4% of Powhatan County residents lived in poverty the lowest rate compared to all counties. As in many other Republican-leaning areas, the county was predominantly white, with 84.5% of its 28,108 residents identifying solely as white.
Washington
Columbia County cast 69.5% of its 2012 vote for Romney, the largest share of any county in Washington. About 17.1% of county residents lived in poverty from 2009 through 2013, higher than the national poverty rate of 15.4% over the same period. Additionally, the county was overwhelmingly white, with 92.1% of its 4,027 residents identifying solely as white. Columbia County residents were also relatively poorly educated. Only 17.2% of residents had at least a bachelor’s degree, far below the comparable national figure of 28.8%.
ALSO READ: The States Where the Rich Are Getting Richer
West Virginia
Romney won 71.7% of the Upshur County 2012 vote, the largest share of any county in West Virginia. About 18.4% of county residents lived in poverty from 2009 through 2013, higher than the national poverty rate of 15.4% over the same period. The county was also overwhelmingly white, with 97.4% of its 24,371 residents identifying solely as white. Upshur County residents were also relatively poor. A typical household earned only $39,381, far below the comparable national figure of $53,046.
Wisconsin
Some 69.6% of Washington County residents who cast a ballot in 2012 voted for Romney. Relatively fewer people in the county lived in poverty from 2009 through 2013 than across the nation. Nearly all of the county’s 132,186 residents identified solely as white. Tammy Baldwin currently represents Wisconsin in the Senate. She is also the nation’s first openly gay Senator. Wisconsin Governor Scott Walker is widely expected to announce his bid for the Republican presidential nomination later this summer. Many Republicans in the state are likely thrilled to have a Wisconsin native on the ballot. However, according to the New York Times, Walker faces a battle with Republicans in the state’s legislature, who have rejected several of his proposals in recent sessions.
ALSO READ: The Best (and Worst) States for Business
Wyoming
Campbell is the most Republican county in Wyoming, casting 85.6% of its votes for Mitt Romney. The county was overwhelmingly white, with just over 92% of its residents identifying solely as white. Campbell county residents were also quite wealthy. In the five years through 2013, the median household income was $79,488, well above the comparable national figure of $53,046.
ALSO READ: 10 States With the Most Gun Violence
Contact [email protected] for any questions or corrections.